February 14, 2026 a 09:03 am

ROST: Trend and Support & Resistance Analysis - Ross Stores, Inc.
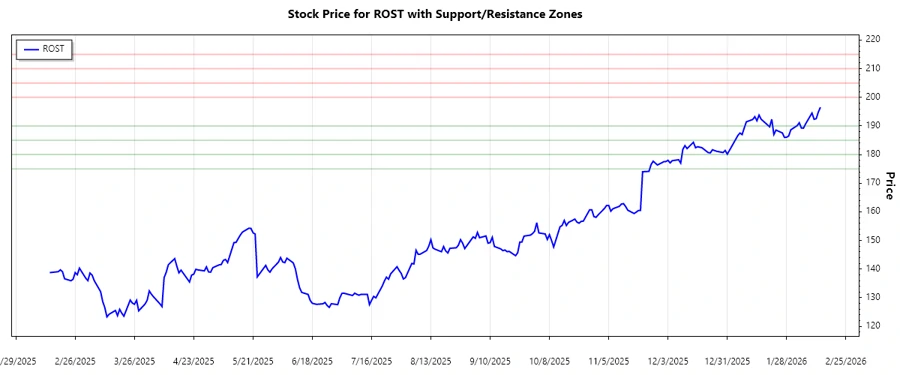
Ross Stores, Inc. has shown resilience in its market positioning with a clear bullish recovery in the recent months. Their discount retail model continues to attract a varied customer base, supporting steady financial performance. Given the recent price movements, ROST is currently around significant support levels, which could offer buying opportunities.
Trend Analysis
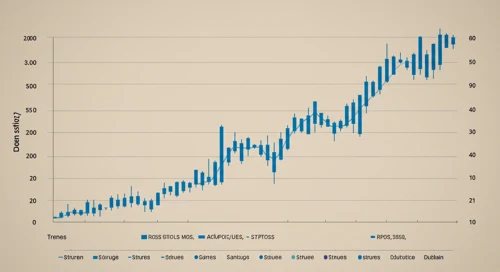
Over the past few months, Ross Stores, Inc. (ROST) has illustrated a strong upward trend, especially after recovering from the lows seen towards the end of the previous year. Calculating the exponential moving averages (EMAs), the recent crossover of EMA20 above EMA50 signifies a bullish sentiment. This upward trajectory is indicative of potential investor confidence and momentum in the stock.
| Date | Close Price | Trend |
|---|---|---|
| 2026-02-13 | 196.54 | ▲ Upward |
| 2026-02-12 | 194.85 | ▲ Upward |
| 2026-02-11 | 192.54 | ▲ Upward |
| 2026-02-10 | 192.33 | ▲ Upward |
| 2026-02-09 | 194.50 | ▲ Upward |
| 2026-02-06 | 190.74 | ▲ Upward |
| 2026-02-05 | 189.23 | ▲ Upward |
The consistent upward movement suggests ROST is in a strong bullish phase. This may attract momentum traders looking to capitalize on the trend.
Support- and Resistance
Analysis of the price data indicates notable support and resistance zones. Distinct support zones can be identified around the $185-$190 range, while resistance is observed around the $200 level. These zones are critical as they represent psychological barriers for traders.
| Zone Type | From | To |
|---|---|---|
| Support Zone 1 | $185 | $190 |
| Support Zone 2 | $175 | $180 |
| Resistance Zone 1 | $200 | $205 |
| Resistance Zone 2 | $210 | $215 |
Currently, ROST is approaching the resistance zone close to $200 potentially signifying an upcoming challenge for continued upward momentum.
Conclusion
Ross Stores, Inc. is positioned in a strong market scenario with a stable upward trend. While moving towards a crucial resistance zone, the stock holds potential for further gains if it breaks past these psychological barriers. The key risk exists if the stock faces persistent resistance at the $200-$205 levels leading to a corrective phase. Traders should monitor these zones for long-term positioning. Overall, ROST appears to remain attractive with its robust near-term momentum complemented by solid support zones. Analysts may consider this for long positions with calculated risk measures.