May 04, 2026 a 03:15 pm

ROST: Fibonacci Analysis - Ross Stores, Inc.
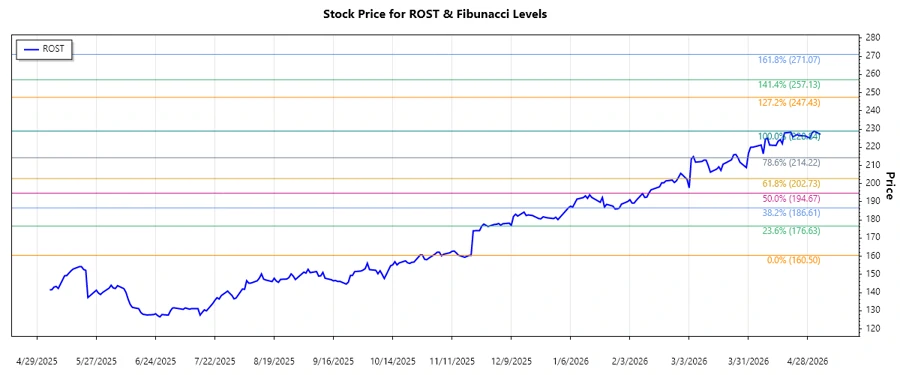
Ross Stores, Inc. has shown a robust upward trend over the past months, reflecting its strategic positioning in off-price retail. The stock has reached new highs, driven by increased consumer spending and operational efficiency. This upward momentum indicates a strong investor confidence, suggesting potential for further growth in the medium to long term.
Fibonacci Analysis
| Attribute | Details |
|---|---|
| Trend Period | 2025-11-20 to 2026-05-04 |
| High Point | Price: $228.84 on 2026-05-01 |
| Low Point | Price: $160.5 on 2025-11-20 |
| Fibonacci Levels |
|
| Current Price | $227.09 (as of 2026-05-04) |
| Retracement Zone | 0.786 |
| Technical Interpretation | The current price is in the 0.786 Fibonacci retracement area, indicating a strong resistance level. A breakthrough could signal further upside potential. |
Conclusion
The analysis of Ross Stores, Inc. stock underlines a sustained upward trend, further bolstered by its performance in the off-price retail sector. The current price position, within the 0.786 Fibonacci level, poses both an opportunity and a risk. A breakthrough might lead to continued bullish momentum, tapping into higher consumer spending trends. However, a failure to surpass this resistance could result in a consolidation phase. Investors should closely monitor market cues and consumer behavior to either capitalize on or hedge against potential volatility in the stock's price action.
Smart Data Insight
Master the Perfect Entry & Exit for this Stock
Don't leave your profits to chance. Historically, this stock follows specific seasonal patterns that institutional traders use to maximize returns.
- ✅ Identify the "Golden Buying Window"
- ✅ Avoid high-risk correction cycles
- ✅ Backtested data from the last 20+ years