April 15, 2026 a 06:44 am
ROST: Fibonacci Analysis - Ross Stores, Inc.
The Ross Stores, Inc. stock has recently demonstrated a strong upward trend. As a leading off-price retailer, Ross Stores, Inc. benefits from consistent demand for discounted apparel and home fashion items. The company's expansive reach across the U.S. further solidifies its market position. Investors should note the sustained growth driven by strategic expansion and consumer trends favoring discount shopping.
Fibonacci Analysis
| Metric | Details |
|---|---|
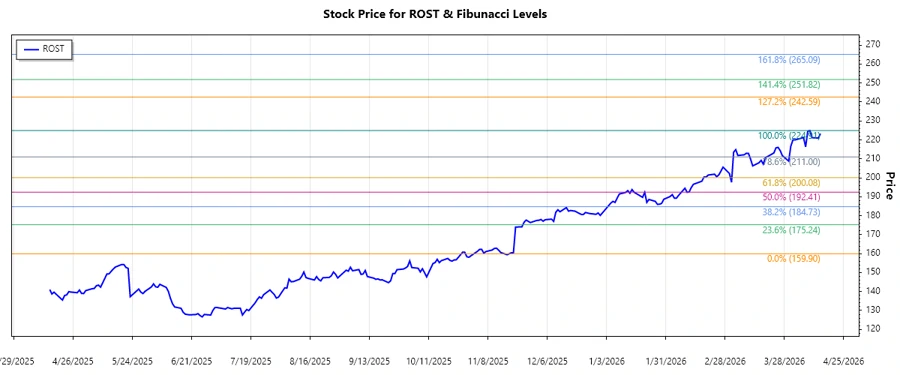
| Trend Start Date | 2025-11-19 |
| Trend End Date | 2026-04-09 |
| High Point | $224.91 on 2026-04-09 |
| Low Point | $159.9 on 2025-11-18 |
| Fibonacci Levels |
|
| Current Price | $223.29 |
| Retracement Zone | None |
The current price of $223.29 is outside the main Fibonacci retracement levels, indicating that it is not in any retracement zone. This could suggest potential continuation of the current trend and resistance levels might not be significant at present prices.
Conclusion
The stock of Ross Stores, Inc. continues to present robust growth dynamics driven by consumer shifts toward discount shopping and strategic expansion. Despite pressures within the retail sector, Ross has shown resilience. However, investors should remain cautious about potential macroeconomic factors that could affect consumer spending habits. The current upward trend suggests positive momentum, though vigilance around resistance levels identified by Fibonacci analysis is advised. Continued observation of price movement against key retracement levels will be crucial in assessing potential points of resistance or support.