November 17, 2025 a 03:15 pm

ROST: Fibonacci Analysis - Ross Stores, Inc.
Ross Stores, Inc. (ROST) has shown impressive resilience in its recent trading trends, overcoming market challenges with a dominant upward trajectory. This off-price retail brand continues to leverage its unique business model, appealing effectively to middle-income households. Significant market fluctuations present both opportunities and challenges, yet ROST remains a strong contender in the retail sector. Currently, its performance indicates a robust support level with promising signs of continued growth.
Fibonacci Analysis
| Attribute | Details |
|---|---|
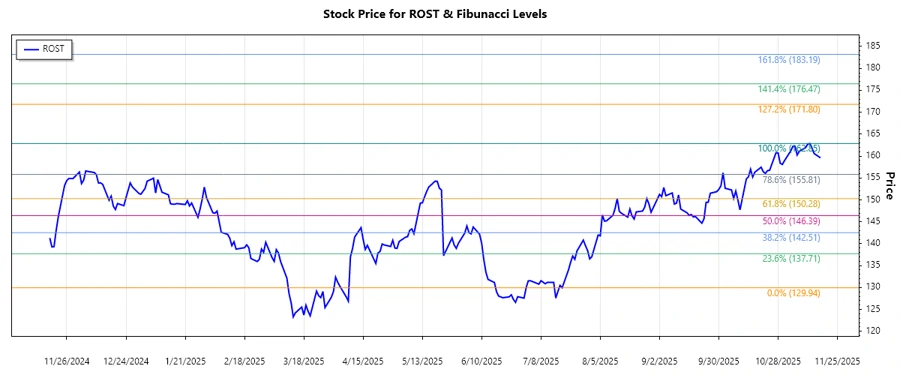
| Start Date | 2025-07-17 |
| End Date | 2025-11-12 |
| High Point | $162.85 on 2025-11-12 |
| Low Point | $129.94 on 2025-07-17 |
Fibonacci Levels
| Retracement Level | Price Level |
|---|---|
| 23.6% | $153.55 |
| 38.2% | $148.87 |
| 50% | $146.40 |
| 61.8% | $143.93 |
| 78.6% | $140.32 |
The current price of $159.59 suggests the stock is outside the retracement zone, indicating it may approach resistance around the previous high.
This technical setting implies that the stock showcases a strong uptrend momentum. Once breaking the high, the ROST could potentially surpass previous resistance levels, paving the way for future gains.
Conclusion
Ross Stores, Inc. demonstrates a formidable upward momentum, bolstered by strategic positioning within the retail sector. Despite potential market volatility, ROST's innovative business model and expansive reach support sustained growth. Analysts should monitor resistance levels while considering useful entry points. With current data trends, the stock offers favorable long-term prospects but requires vigilance against abrupt market shifts. Hence, further investments could yield sizable returns, provided market conditions align.