August 16, 2025 a 05:15 am

ROST: Fibonacci Analysis - Ross Stores, Inc.
Ross Stores, Inc., operating under its Ross Dress for Less and dd's DISCOUNTS brands, continues to show resilience in the retail sector with a significant market presence. The stock's performance over recent months indicates a dominant downward trend, providing an opportunity to explore potential retracement levels. Investors should carefully consider these technical levels when evaluating entry points.
Fibonacci Analysis
| Criteria | Details |
|---|---|
| Trend Start Date | 2024-12-09 |
| Trend End Date | 2025-07-18 |
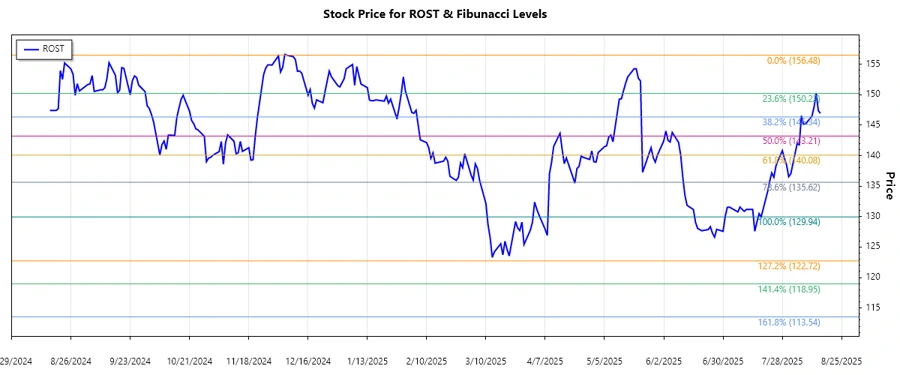
| High Price | $156.48 on 2024-12-06 |
| Low Price | $129.94 on 2025-07-18 |
| Fibonacci Level | Price Level |
|---|---|
| 0.236 | $137.25 |
| 0.382 | $141.15 |
| 0.500 | $143.21 |
| 0.618 | $145.26 |
| 0.786 | $148.12 |
The current price is $146.94 as of 2025-08-15, which indicates that the stock is trading around the 0.618 retracement level. This level could potentially act as a resistance point, suggesting investors monitor for possible price reversals or accumulation phases.
This chart visually demonstrates the stock's observed downward trend and key Fibonacci levels.
Conclusion
Ross Stores, Inc. faces both opportunities and challenges within its market segment. The identified downward trend suggests potential for retracement that could appeal to short-term traders. However, investors need to consider the overall economic environment impacting retail consumption. The retracement at the 0.618 level may present a strong resistance, which would require significant buying interest to overcome. For long-term investors, assessing the company’s strategic initiatives to mitigate market headwinds is crucial. This analysis highlights the importance of technical levels in informing trading decisions.
Smart Data Insight
Master the Perfect Entry & Exit for this Stock
Don't leave your profits to chance. Historically, this stock follows specific seasonal patterns that institutional traders use to maximize returns.
- ✅ Identify the "Golden Buying Window"
- ✅ Avoid high-risk correction cycles
- ✅ Backtested data from the last 20+ years