
June 08, 2026 a 12:47 pm

ROST: Dividend Analysis - Ross Stores, Inc.
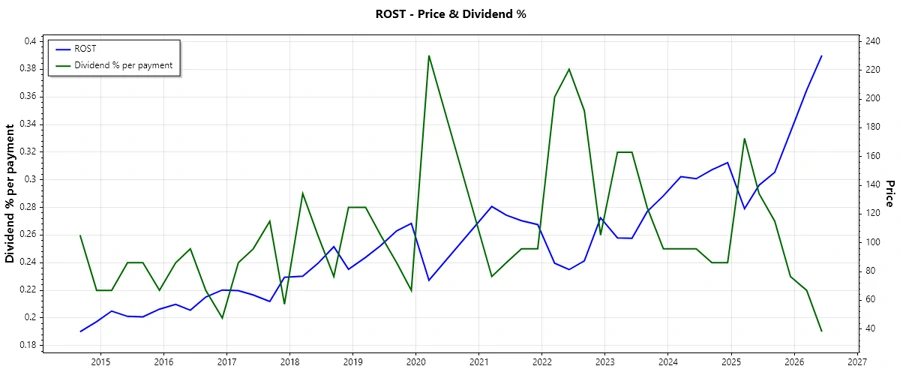
Ross Stores, Inc. demonstrates a conservative yet promising dividend profile with a moderate yield and consistent growth, reflecting the company's solid financial standing. With a commendable history of 33 years of dividend payments and no recent cuts or suspensions, ROSS is a reliable dividend candidate in the retail apparel sector. The company’s payout ratios suggest sustainable distributions, making it a viable long-term investment.
📊 Overview
The overview of Ross Stores, Inc. highlights its performance within the retail industry, specifically in the apparel sector. This segment often reflects consumer discretionary spending, which can impact yield predictability. The company offers a modest dividend yield of 0.74%, supported by a current dividend per share of $1.65. A history of 33 years of dividends indicates consistent shareholder returns.
| Metric | Value |
|---|---|
| Sector | Apparel Retail |
| Dividend yield | 0.74% |
| Current dividend per share | $1.65 |
| Dividend history | 33 years |
| Last cut or suspension | None |
🗣️ Dividend History
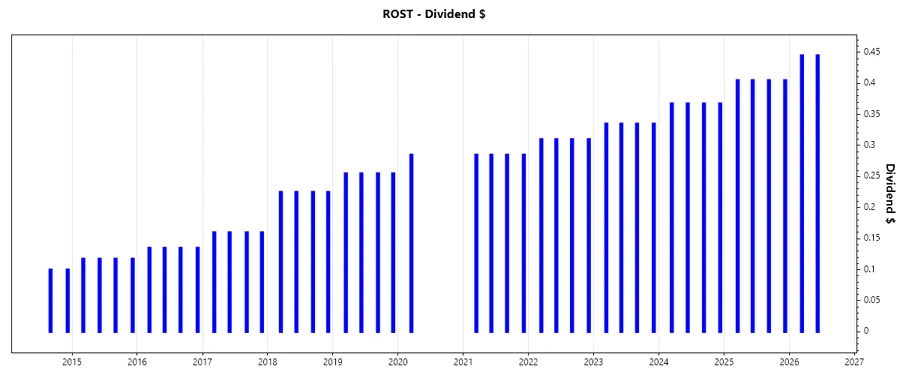
The dividend history of Ross Stores, Inc. reflects its commitment to rewarding shareholders. Consistent dividend payments are crucial, as they contribute to overall investor confidence.
| Year | Dividend per Share (USD) |
|---|---|
| 2026 | 0.890 |
| 2025 | 1.620 |
| 2024 | 1.470 |
| 2023 | 1.340 |
| 2022 | 1.240 |
📈 Dividend Growth
Dividend growth is a critical aspect of income investing. Ross Stores, Inc. has shown notable growth, with 3-year and 5-year growth rates highlighting a steady upward trajectory.
| Time | Growth |
|---|---|
| 3 years | 9.32% |
| 5 years | 41.56% |
The average dividend growth is 41.56% over 5 years. This shows moderate but steady dividend growth.
⚠️ Payout Ratio
The payout ratio is crucial in assessing dividend safety. This ratio helps investors determine how likely a firm is to maintain its dividend in challenging times.
| Key figure | Ratio |
|---|---|
| EPS-based | 22.75% |
| Free cash flow-based | 20.13% |
The EPS-based payout ratio of 22.75% and FCF-based payout ratio of 20.13% indicate a prudent approach to distributing earnings, supporting sustainable dividend payouts.
💡 Cashflow & Capital Efficiency
Understanding cash flow dynamics and capital efficiency is essential for evaluating a company's ability to generate sufficient cash to cover dividends and reinvest.
| Metric | 2023 | 2024 | 2025 |
|---|---|---|---|
| Free Cash Flow Yield | 3.73% | 3.31% | 3.66% |
| Earnings Yield | 3.99% | 4.23% | 3.56% |
| CAPEX to Operating Cash Flow | 30.34% | 30.55% | 27.07% |
| Stock-based Compensation to Revenue | 0.71% | 0.74% | 0.77% |
| Free Cash Flow / Operating Cash Flow Ratio | 69.66% | 69.45% | 72.93% |
The stable cash flow generation and efficient capital deployment reflect Ross Stores' ability to sustain its dividend payments and reinvest in growth opportunities effectively.
📉 Balance Sheet & Leverage Analysis
A thorough balance sheet analysis helps understand the company's financial health and ability to manage debt effectively.
| Metric | 2023 | 2024 | 2025 |
|---|---|---|---|
| Debt-to-Equity | 1.18 | 1.03 | 0.84 |
| Debt-to-Assets | 0.40 | 0.38 | 0.34 |
| Debt-to-Capital | 0.54 | 0.51 | 0.46 |
| Net Debt to EBITDA | 0.30 | 0.29 | 0.17 |
| Current Ratio | 1.77 | 1.62 | 1.58 |
| Quick Ratio | 1.24 | 1.09 | 1.04 |
| Financial Leverage | 2.94 | 2.71 | 2.51 |
Ross Stores exhibits a robust balance sheet with manageable leverage, which enhances its risk profile and ensures financial flexibility to meet obligations and support dividends.
✅ Fundamental Strength & Profitability
An analysis of profitability metrics offers insights into the company's efficiency in generating earnings relative to its revenue and invested capital.
| Metric | 2023 | 2024 | 2025 |
|---|---|---|---|
| Return on Equity | 38.48% | 37.95% | 34.67% |
| Return on Assets | 13.11% | 14.03% | 13.80% |
| Margins: Gross | 27.36% | 27.78% | 27.95% |
| Net Profit | 9.20% | 9.90% | 9.43% |
| EBIT | 12.49% | 13.35% | 11.90% |
| EBITDA | 14.55% | 15.46% | 15.75% |
| R&D to Revenue | 0.00% | 0.00% | 0.00% |
Despite not relying on R&D expenditures, Ross Stores maintains impressive profit margins and returns, underlining its operational efficiency within the competitive retail sector.
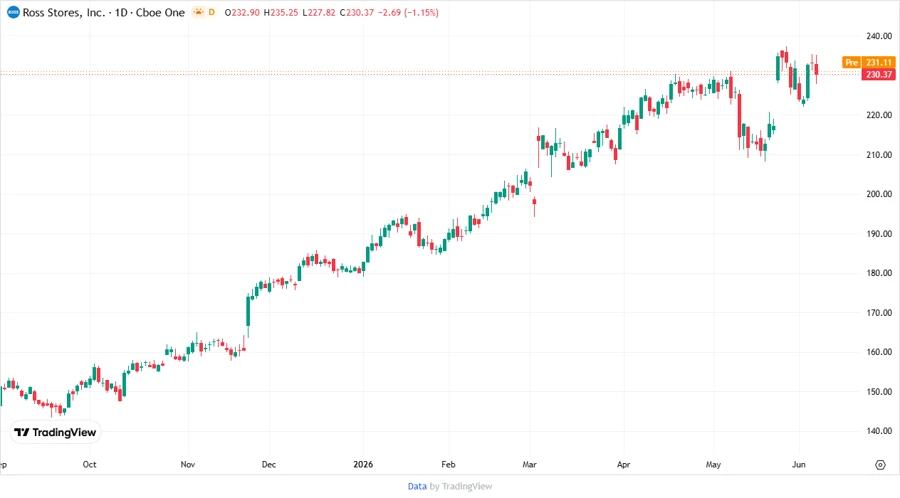
📈 Price Development
Dividend Scoring System
| Criteria | Score | |
|---|---|---|
| Dividend yield | 3 | |
| Dividend Stability | 5 | |
| Dividend growth | 4 | |
| Payout ratio | 5 | |
| Financial stability | 4 | |
| Dividend continuity | 5 | |
| Cashflow Coverage | 4 | |
| Balance Sheet Quality | 5 |
Total Score: 35/40
🗒️ Rating
Ross Stores, Inc. offers a compelling dividend investment opportunity, characterized by stable earnings, prudent payout strategies, and a robust financial position. Its consistent dividend history and growth demonstrate its capability to deliver shareholder value over the long term. The company's strategic management and solid market position in the retail apparel sector further strengthen its investment appeal.
Smart Data Insight
Master the Perfect Entry & Exit for this Stock
Don't leave your profits to chance. Historically, this stock follows specific seasonal patterns that institutional traders use to maximize returns.
- ✅ Identify the "Golden Buying Window"
- ✅ Avoid high-risk correction cycles
- ✅ Backtested data from the last 20+ years