
July 23, 2026 a 06:45 am
ROL: Fibonacci Analysis - Rollins, Inc.
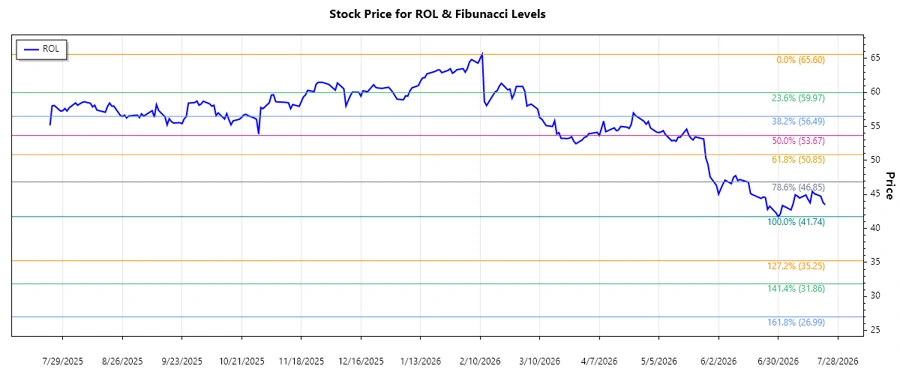
Rollins, Inc. (Ticker: ROL) has faced a considerable downward trend in its stock price over the past few months, indicating investor caution or broader market challenges. Despite the recent declines, the company's strong fundamentals and consistent revenue stream from pest control services offer potential stability. The current market conditions may provide strategic entry points for investors who believe in the company’s long-term growth prospects.
Fibonacci Analysis
| Details | Information |
|---|---|
| Start Date of Trend | 2025-12-31 |
| End Date of Trend | 2026-07-22 |
| Highest Price & Date | $65.60 on 2026-02-11 |
| Lowest Price & Date | $41.74 on 2026-06-30 |
| Fibonacci Level 0.236 | $47.77 |
| Fibonacci Level 0.382 | $50.87 |
| Fibonacci Level 0.5 | $53.67 |
| Fibonacci Level 0.618 | $56.48 |
| Fibonacci Level 0.786 | $60.00 |
| Current Price Status | The current price is in the 0.236 to 0.382 retracement zone, suggesting initial resistance might be met. |
Conclusion
Rollins, Inc. has experienced a significant drawdown in its stock price due to prevailing market conditions, but its underlying business model remains robust. The observed Fibonacci retracement levels indicate potential price resistance, with the stock hovering between key Fibonacci zones. While there could be technical resistance observed at higher retracement levels, the firm’s consistent service offering and customer base provide a solid groundwork for recovery. Investors should keep an eye on market trends and company reports which might offer insights into future movements. In conclusion, while the short-term trend is bearish, the long-term outlook for Rollins, Inc., driven by its solid market penetration and franchise network, remains optimistic.
Smart Data Insight
Master the Perfect Entry & Exit for this Stock
Don't leave your profits to chance. Historically, this stock follows specific seasonal patterns that institutional traders use to maximize returns.
- ✅ Identify the "Golden Buying Window"
- ✅ Avoid high-risk correction cycles
- ✅ Backtested data from the last 20+ years