May 09, 2026 a 04:44 pm
ROL: Fibonacci Analysis - Rollins, Inc.
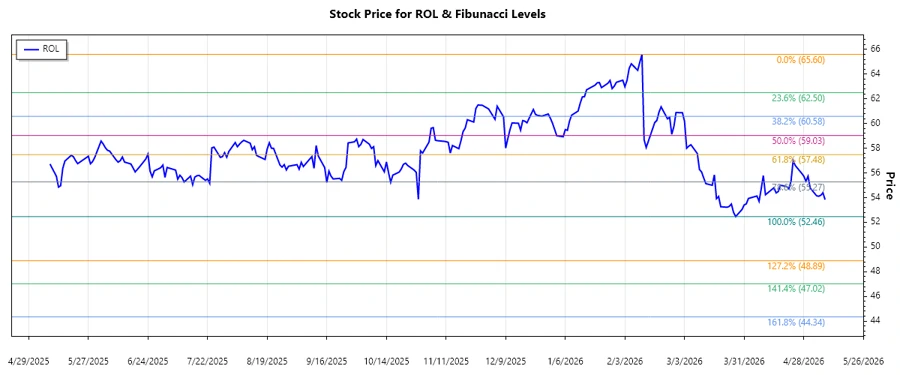
The Rollins Inc. stock shows a fluctuating trend, mostly exhibiting an extension of a downward trajectory from its peak in February 2026. The recent data reveals a descent from quite significant highs, reflecting potential challenges in maintaining bullish momentum. It's crucial for investors to consider the potential resistance and support levels derived from historical Fibonacci retracement that could impact decision-making.
Fibonacci Analysis
| Detail | Value |
|---|---|
| Start Date | 2025-11-11 |
| End Date | 2026-05-08 |
| High Price & Date | $65.6 (2026-02-11) |
| Low Price & Date | $52.46 (2026-03-27) |
| Fibonacci Level | Price |
|---|---|
| 0.236 | $55.35 |
| 0.382 | $57.21 |
| 0.5 | $59.03 |
| 0.618 | $60.85 |
| 0.786 | $63.14 |
As of the last available price, the stock hovers around $53.83, thereby remaining outside the primary Fibonacci retracement zones, suggesting potential further decline or consolidation.
Technically, the absence within retracement zones might foreshadow either a foundation for new support or a prolonged descent towards lower lows if not met with renewed buying interest.
Conclusion
Rollins Inc. currently demonstrates potential weaknesses associated with its extended downtrend, positioning its current price below significant Fibonacci retracement levels. Market observers and traders should remain cognizant of emerging patterns that might influence reversals or continuity of the present trajectory. While low current positioning may signify reduced investor appetite, potential upside exists if strategic support levels inspire confidence among stakeholders.
Smart Data Insight
Master the Perfect Entry & Exit for this Stock
Don't leave your profits to chance. Historically, this stock follows specific seasonal patterns that institutional traders use to maximize returns.
- ✅ Identify the "Golden Buying Window"
- ✅ Avoid high-risk correction cycles
- ✅ Backtested data from the last 20+ years