April 23, 2026 a 11:44 am

ROL: Fibonacci Analysis - Rollins, Inc.
Rollins, Inc. (ROL) has experienced a significant downward trend over the last months. As a company providing pest and wildlife control services, the stock's performance reflects the current challenges in maintaining service profitability amidst fluctuating costs. Despite these challenges, the firm's extensive franchise network and diversified service offerings provide a foundation for potential recovery and growth.
Fibonacci Analysis
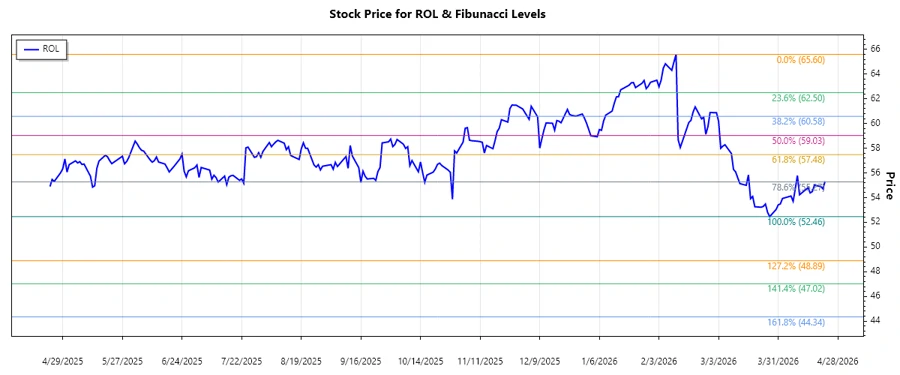
The analysis of Rollins, Inc. has identified a strong downtrend in the stock price from early February 2026 to late April 2026.
| Aspect | Details |
|---|---|
| Start Date | 2026-02-11 |
| End Date | 2026-04-22 |
| High | 65.60 (2026-02-11) |
| Low | 52.46 (2026-03-27) |
Fibonacci Retracement Levels
| Level | Price |
|---|---|
| 0.236 | 55.50 |
| 0.382 | 57.28 |
| 0.5 | 59.03 |
| 0.618 | 60.78 |
| 0.786 | 62.81 |
The current price is $55.32, which positions it within the 0.236 retracement level. This indicates that the stock might be finding some support at this level, but there's no significant recovery yet.
This could potentially indicate a temporary pause or consolidation in the downtrend. If prices manage to breach this level, it might suggest an attempt at reversing the momentum.
Conclusion
While Rollins, Inc. shows signs of finding support at the 0.236 Fibonacci level, the prevailing downtrend is a clear risk factor. The firm faces substantial market challenges, but its diversified portfolio and robust service network may help stabilize its financial performance. Analysts should monitor these Fibonacci levels closely as potential indicators of future price movement. The overall risk remains unless a clearer upward reversal is established. Long-term prospects depend on consistent operational execution and adaptability to economic changes.