February 13, 2026 a 04:44 pm
ROL: Fibonacci Analysis - Rollins, Inc.
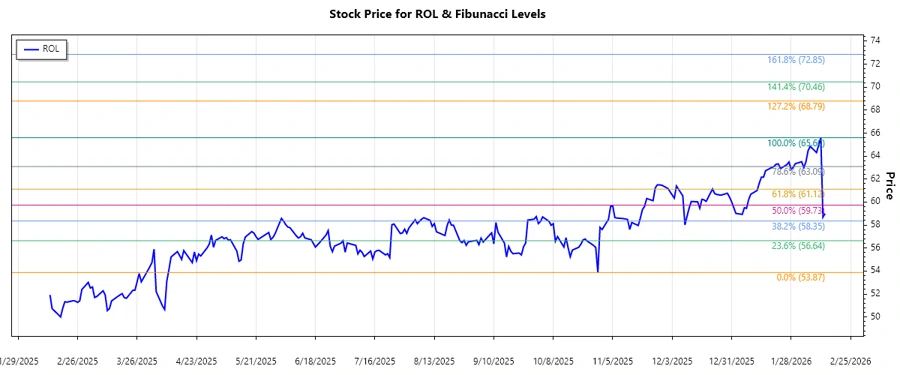
Rollins, Inc. has experienced a significant uptrend over recent months, with the stock witnessing a marked increase in price. Known for its robust pest control services, the company has managed to expand its market reach, thus benefiting from a growing client base. This growth trajectory has similarly reflected in its stock price, prompting further interest from investors.
Fibonacci Analysis
| Parameter | Details |
|---|---|
| Trend Start Date | 2025-10-29 |
| Trend End Date | 2026-02-11 |
| High Price | 65.6 on 2026-02-11 |
| Low Price | 53.87 on 2025-10-29 |
| Fibonacci Level | Price Level |
|---|---|
| 0.236 | 62.43 |
| 0.382 | 60.93 |
| 0.5 | 59.73 |
| 0.618 | 58.54 |
| 0.786 | 56.91 |
The current price of Rollins, Inc. is 59, which is within the 0.382 Fibonacci retracement zone. This suggests that the stock might find support here, presenting a potential buying opportunity if the broader market conditions are favorable.
Conclusion
Rollins, Inc.'s upward trend emphasizes the company's positive market position and growth prospects. With the stock price currently positioned within a key Fibonacci retracement zone, technical analysts might infer potential support levels. However, market volatility and external economic conditions still pose risks to sustaining this trend. Nonetheless, the ongoing demand for pest control services suggests a stable revenue stream, protecting against potential fluctuations in stock value.