November 15, 2025 a 03:15 pm

ROL: Fibonacci Analysis - Rollins, Inc.
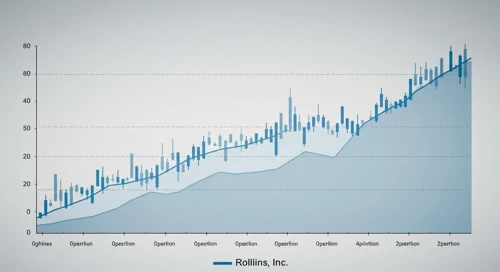
Rollins, Inc., operating in the pest and wildlife control industry, demonstrates a prominent upward trend in its stock price over the past months. The company's broad service offerings to residential and commercial customers have likely contributed to its steady growth, reflecting its resilience and strategic operations in diverse markets. Investors may find the stock appealing, given the firm's continuous expansion and market adaptability.
Fibonacci Analysis
The stock has been in an upward trend, with significant fluctuations observed. Analyzing the data from the period between April 8, 2025, and November 14, 2025, the following are the key levels calculated using Fibonacci retracement.
| Parameter | Details |
|---|---|
| Trend Start Date | 2025-04-08 |
| Trend End Date | 2025-11-14 |
| High Price | 59.67 on 2025-11-05 |
| Low Price | 50.65 on 2025-04-08 |
Fibonacci Levels
| Level | Price |
|---|---|
| 0.236 | 53.22 |
| 0.382 | 54.95 |
| 0.5 | 55.16 |
| 0.618 | 56.68 |
| 0.786 | 58.38 |
The current price is at 58.22, which is within the 0.786 retracement zone. This zone may act as a potential resistance level in future trading sessions.
Technically, a retracement to these levels could suggest a sustainable pullback or signal a buying opportunity as prices consolidate.
Conclusion
Rollins, Inc. stock is demonstrating a strong upward trend supported by a stable market presence and demand for pest control services. The rise in stock prices is likely influenced by the company's ability to meet diverse customer needs effectively. While the stock currently tests resistance levels, breaking through could signify continued growth. However, investors should remain cautious of potential market shifts or operational challenges that could impact this trajectory. As the current price nears the higher Fibonacci level, technical signals should be monitored for future price action direction, providing strategic entry or exit points.
Smart Data Insight
Master the Perfect Entry & Exit for this Stock
Don't leave your profits to chance. Historically, this stock follows specific seasonal patterns that institutional traders use to maximize returns.
- ✅ Identify the "Golden Buying Window"
- ✅ Avoid high-risk correction cycles
- ✅ Backtested data from the last 20+ years