October 07, 2025 a 05:15 am
ROL: Fibonacci Analysis - Rollins, Inc.
Rollins, Inc. is a leading pest and wildlife control services provider, with a strong presence in both residential and commercial markets. Over recent months, its stock has shown significant performance volatility. Given its recent price history and trend patterns, it is crucial to identify potential support and resistance levels through Fibonacci retracement analysis to better understand future price behavior.
Fibonacci Analysis
| Trend Period | High Price | High Date | Low Price | Low Date |
|---|---|---|---|---|
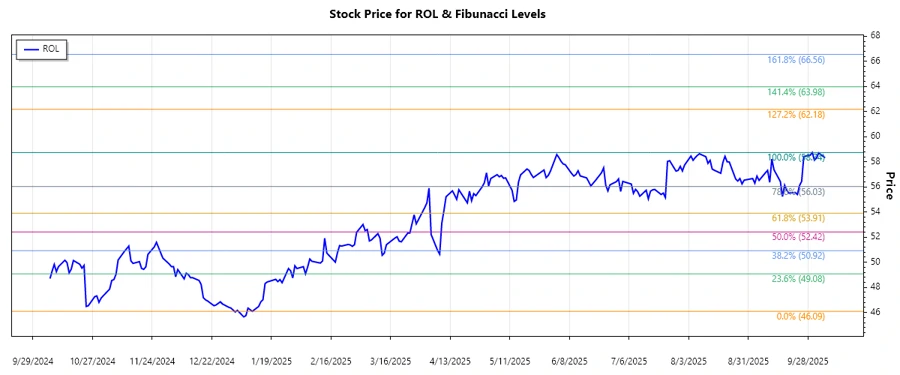
| 2024-11-07 to 2025-09-30 | $58.74 | 2025-09-30 | $46.09 | 2025-01-10 |
| Fibonacci Level | Price Level |
|---|---|
| 0.236 | $51.97 |
| 0.382 | $53.86 |
| 0.5 | $54.92 |
| 0.618 | $55.97 |
| 0.786 | $57.52 |
The current price ($58.32) is above all Fibonacci retracement levels, indicating a strong position above potential support levels. This suggests the stock is potentially in a breakout phase, possibly forming new resistance around its recent high.
Conclusion
Rollins, Inc. has displayed a strong upward trend over recent months. The stock trades above significant Fibonacci levels, highlighting potential support zones that, if tested, could offer buying opportunities. However, new investors should be cautious of potential resistance around recent peaks. Technically, the price action suggests bullish sentiment, but market conditions and broader economic factors must also be considered. The analysis implies potential for continued upward momentum, but investors should remain vigilant of any market shifts.
Smart Data Insight
Master the Perfect Entry & Exit for this Stock
Don't leave your profits to chance. Historically, this stock follows specific seasonal patterns that institutional traders use to maximize returns.
- ✅ Identify the "Golden Buying Window"
- ✅ Avoid high-risk correction cycles
- ✅ Backtested data from the last 20+ years