September 03, 2025 a 03:15 pm
ROL: Fibonacci Analysis - Rollins, Inc.
Rollins, Inc. offers essential services in pest and wildlife control with a wide-ranging international reach. Despite the competitive market, its financial performance remains resilient due to its extensive client network and efficient service delivery. The stock has shown significant movement lately, which is crucial for traders to evaluate for potential entry points.
Fibonacci Analysis
| Analysis Detail | Value |
|---|---|
| Trend Start Date | 2024-11-06 |
| Trend End Date | 2025-09-03 |
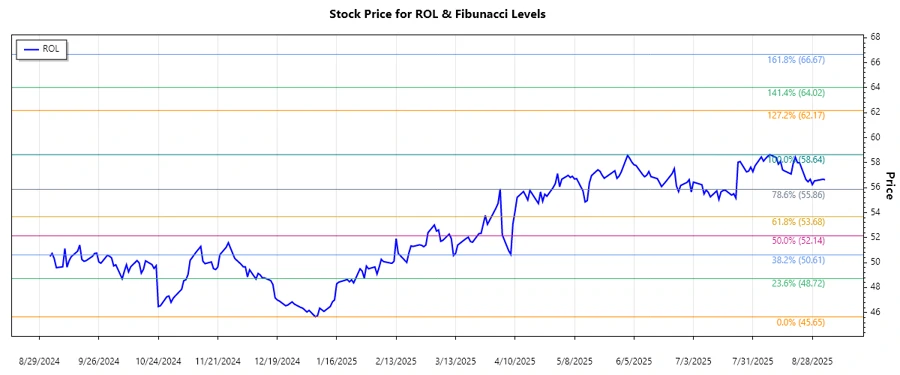
| High (Price & Date) | 58.64 on 2025-08-08 |
| Low (Price & Date) | 45.65 on 2025-01-06 |
| Fibonacci Levels |
|
| Current Price | 56.63 |
| Retracement Zone | 0.618 |
The stock is currently in the 0.618 Fibonacci retracement zone, suggesting potential support. This level is often seen as a bounce area, where prices may find support before potentially resuming an upward path.
Conclusion
The recent retracement to the key Fibonacci level of 0.618 indicates a potential support area for Rollins Inc. stock. Analysts may see this as a buying opportunity, anticipating a bounce back into a continued uptrend. However, investors should be wary of further downturns if the price falls below this key level.
Smart Data Insight
Master the Perfect Entry & Exit for this Stock
Don't leave your profits to chance. Historically, this stock follows specific seasonal patterns that institutional traders use to maximize returns.
- ✅ Identify the "Golden Buying Window"
- ✅ Avoid high-risk correction cycles
- ✅ Backtested data from the last 20+ years