December 16, 2025 a 11:31 am


ROL: Dividend Analysis - Rollins, Inc.
Rollins, Inc. presents a compelling case for dividend-focused investors. With a robust dividend history spanning over 41 years, the company demonstrates a strong commitment to rewarding shareholders. A growing dividend yield and conservative payout ratios further enhance its attractiveness. Strategic financial management underpins sustainable future payouts, promising stability in an ever-evolving market.
📊 Overview
Rollins, Inc. is a leader in its sector, offering a stable dividend yield and consistent payouts.
| Metric | Value |
|---|---|
| Sector | Consumer Services |
| Dividend yield | 1.16 % |
| Current dividend per share | 0.6154 USD |
| Dividend history | 41 years |
| Last cut or suspension | 2002 |
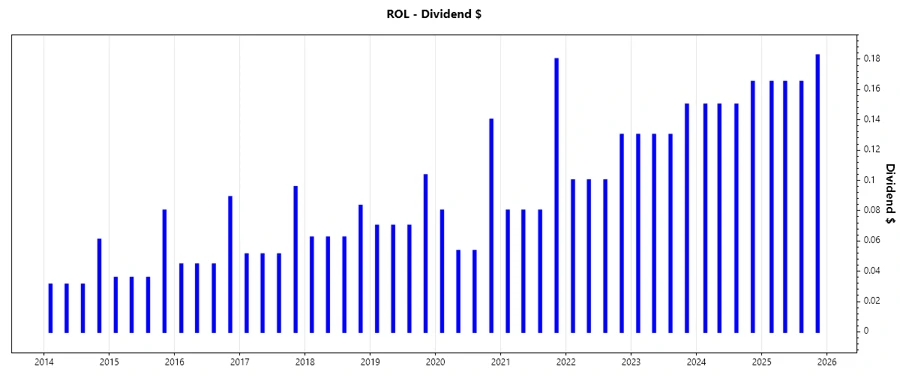
📈 Dividend History
Rollins, Inc.'s long history of dividend payments reflects its stable cash flow and robust financial health.
| Year | Dividend per Share |
|---|---|
| 2025 | 0.6775 USD |
| 2024 | 0.615 USD |
| 2023 | 0.54 USD |
| 2022 | 0.43 USD |
| 2021 | 0.42 USD |
📈 Dividend Growth
Understanding historical dividend growth is essential for predicting future payout increases.
| Time | Growth |
|---|---|
| 3 years | 13.56 % |
| 5 years | 14.44 % |
The average dividend growth is 14.44 % over 5 years. This shows moderate but steady dividend growth.
📊 Payout Ratio
Payout ratios provide insight into dividend sustainability concerning earnings and free cash flow.
| Key figure | Ratio |
|---|---|
| EPS-based | 57.81 % |
| Free cash flow-based | 44.17 % |
These payout ratios imply a balanced and sustainable dividend policy, with sufficient room for future growth.
📊 Cashflow & Capital Efficiency
Optimal cash flow and high capital efficiency are critical indicators for dividend sustainability.
| Metric | 2024 | 2023 | 2022 |
|---|---|---|---|
| Free Cash Flow Yield | 2.58 % | 2.32 % | 2.42 % |
| Earnings Yield | 2.08 % | 2.03 % | 2.05 % |
| CAPEX to Operating Cash Flow | 4.54 % | 6.14 % | 6.57 % |
| Stock-based Compensation to Revenue | 0.88 % | 0.80 % | 0.79 % |
| Free Cash Flow / Operating Cash Flow Ratio | 95.46 % | 93.86 % | 93.43 % |
The data shows strong cash flow performance, creating a solid base for continuing and potentially increasing dividends.
📉 Balance Sheet & Leverage Analysis
A robust balance sheet with a manageable level of leverage supports long-term dividend payments.
| Metric | 2024 | 2023 | 2022 |
|---|---|---|---|
| Debt-to-Equity | 61.07 % | 70.64 % | 26.54 % |
| Debt-to-Assets | 28.82 % | 31.45 % | 15.85 % |
| Debt-to-Capital | 37.91 % | 41.40 % | 20.97 % |
| Net Debt to EBITDA | 0.93 | 1.04 | 0.41 |
| Current Ratio | 0.69 | 0.71 | 0.71 |
| Quick Ratio | 0.62 | 0.65 | 0.65 |
| Financial Leverage | 2.12 | 2.25 | 1.67 |
Despite higher leverage, Rollins maintains a healthy balance sheet with efficient debt management.
📈 Fundamental Strength & Profitability
Strong profitability metrics and efficient operations underline Rollins' capacity to maintain and grow dividends.
| Metric | 2024 | 2023 | 2022 |
|---|---|---|---|
| Return on Equity | 35.05 % | 37.64 % | 29.09 % |
| Return on Assets | 16.54 % | 16.76 % | 17.37 % |
| Margins | Net: 13.76 % | 14.15 % | 13.67 % |
| Research & Development to Revenue | 0 % | 0 % | 0 % |
Rollins consistently delivers strong returns on equity and assets, indicating efficient use of capital.
📈 Price Development
✅ Dividend Scoring System
| Criteria | Score | |
|---|---|---|
| Dividend yield | 3 | |
| Dividend Stability | 5 | |
| Dividend growth | 4 | |
| Payout ratio | 4 | |
| Financial stability | 4 | |
| Dividend continuity | 5 | |
| Cashflow Coverage | 3 | |
| Balance Sheet Quality | 4 |
Overall Score: 32/40
🗣️ Rating
Rollins, Inc. secures a strong position among dividend stocks with consistent payouts and stable financial metrics. The excellent dividend history combined with moderate growth potential makes it an appealing choice for income-focused investors. Coverage ratios and a robust balance sheet ensure ongoing sustainability of its dividend program. Consider Rollins, Inc. as a reliable and stable investment for continued dividend income.