October 05, 2025 a 12:47 pm
ROL: Dividend Analysis - Rollins, Inc.
Rollins, Inc. exhibits a robust dividend profile characterized by an admirable history of payouts over numerous decades. With a consistent growth pattern in dividends, it appeals to income-focused investors seeking steady returns in a stable industry.
📊 Overview
Rollins, Inc. operates in the pest control and property management sector, offering a dependable dividend yield that demonstrates its commitment to returning value to shareholders. The company's current dividend yield stands at 1.13%, with dividends consistently paid over the past 41 years, showcasing a legacy of reliability.
| Description | Details |
|---|---|
| Sector | Consumer Services |
| Dividend Yield | 1.13% |
| Current Dividend per Share | 0.615 USD |
| Dividend History | 41 years |
| Last Cut or Suspension | None |
📈 Dividend History
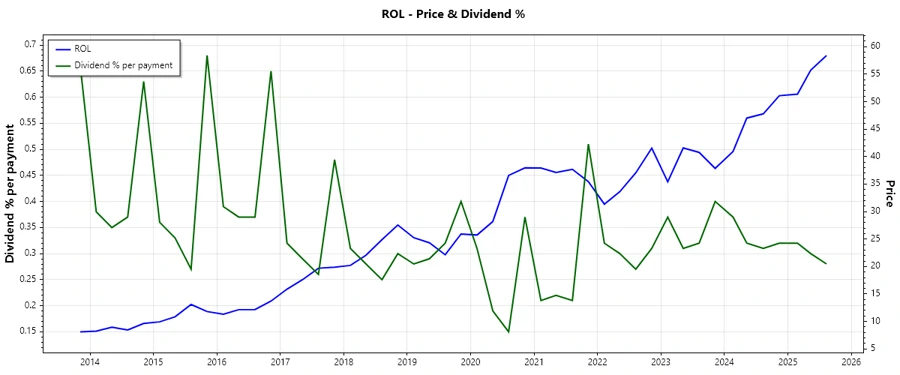
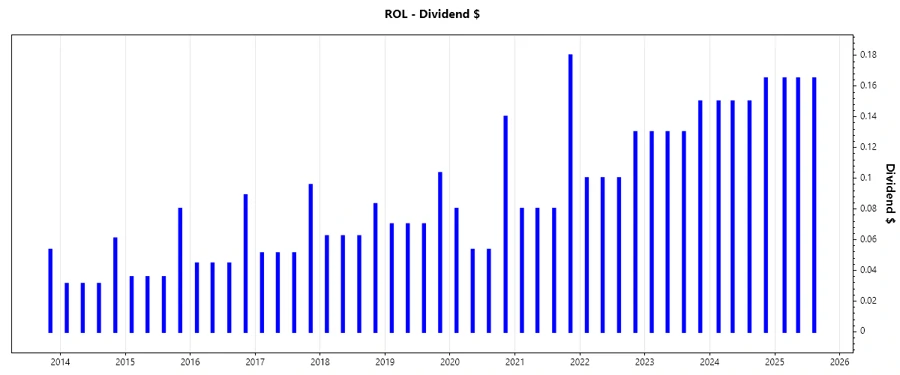
The dividend history of Rollins, Inc. is not only lengthy but also suggests a pattern of uninterrupted payouts even during challenging economic conditions. This reliability makes it an attractive option for conservative income investors.
| Year | Dividend per Share (USD) |
|---|---|
| 2025 | 0.495 |
| 2024 | 0.615 |
| 2023 | 0.54 |
| 2022 | 0.43 |
| 2021 | 0.42 |
📈 Dividend Growth
Evaluating the growth of dividends over the years reveals Rollins, Inc.'s steady record of enhancing shareholder returns. The dividend growth rates are a testament to its financial health and capability to sustain and grow dividends.
| Time | Growth |
|---|---|
| 3 years | 13.56% |
| 5 years | 14.44% |
The average dividend growth is 14.44% over 5 years. This shows moderate but steady dividend growth.
📊 Payout Ratio
Payout ratios provide insight into the sustainability of dividends. It's crucial to compare payouts to earnings (EPS) and cash flow (FCF) to assure investors of consistency and affordability over time.
| Key Figure | Ratio |
|---|---|
| EPS-based | 60.93% |
| Free Cash Flow-based | 47.22% |
The payout ratios suggest that Rollins, Inc. comfortably covers its dividend payments from earnings, although the EPS payout ratio approaches a higher level, the cash flow position remains sound, indicating solid dividend support.
📊 Cashflow & Capital Efficiency
This section evaluates Rollins, Inc.’s financial health, focusing on its ability to generate cash flow and efficiency in utilizing its capital. These are pivotal in sustaining dividends and supporting growth-related activities.
| Metric | 2024 | 2023 | 2022 |
|---|---|---|---|
| Free Cash Flow Yield | 2.58% | 2.32% | 2.42% |
| Earnings Yield | 2.08% | 2.03% | 2.05% |
| CAPEX to Operating Cash Flow | 4.54% | 6.14% | 6.57% |
| Stock-based Compensation to Revenue | 0.88% | 0.80% | 0.79% |
| Free Cash Flow / Operating Cash Flow Ratio | 95.46% | 93.86% | 93.43% |
Rollins, Inc. shows solid cash flow ratios with efficient capital returns, supporting its capacity to maintain healthy dividend payouts while investing in business growth.
📊 Balance Sheet & Leverage Analysis
The balance sheet review offers insights into Rollins, Inc.'s financial stability and debt levels, crucial for assessing its ability to withstand economic challenges and continue its dividend policy.
| Metric | 2024 | 2023 | 2022 |
|---|---|---|---|
| Debt-to-Equity | 0.61 | 0.71 | 0.27 |
| Debt-to-Assets | 0.29 | 0.31 | 0.16 |
| Debt-to-Capital | 0.38 | 0.41 | 0.21 |
| Net Debt to EBITDA | 0.94 | 1.01 | 0.41 |
| Current Ratio | 0.69 | 0.71 | 0.71 |
| Quick Ratio | 0.62 | 0.65 | 0.65 |
| Financial Leverage | 2.12 | 2.25 | 1.67 |
Rollins displays a prudent leverage profile, with relatively low debt levels ensuring resilience and capacity to maintain operations unabated through economic variability.
📊 Fundamental Strength & Profitability
Analyzing profitability metrics provides a lens into Rollins's capacity to enhance shareholder value, highlighting its operational efficiency and market competitiveness.
| Metric | 2024 | 2023 | 2022 |
|---|---|---|---|
| Return on Equity | 35.05% | 37.64% | 29.09% |
| Return on Assets | 16.54% | 16.76% | 17.37% |
| Margins: Net | 13.76% | 14.15% | 13.67% |
| Margins: EBIT | 19.41% | 19.70% | 18.60% |
| Research & Development to Revenue | 0% | 0% | 0% |
Strong profitability metrics underline Rollins, Inc.'s commitment to efficient management practices and sustained shareholder value, suggesting continued confidence in its dividend policy.
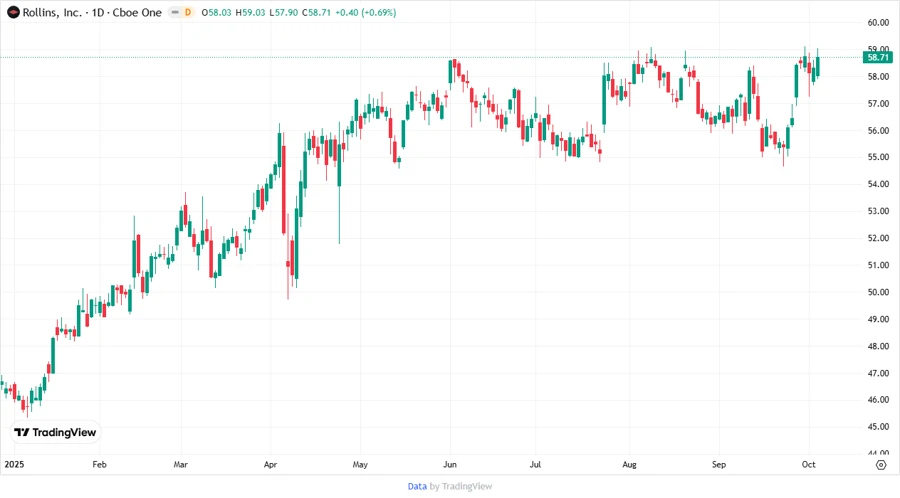
Price Development
🗣️ Dividend Scoring System
| Category | Score | Score Bar |
|---|---|---|
| Dividend Yield | 3 | |
| Dividend Stability | 5 | |
| Dividend Growth | 4 | |
| Payout Ratio | 4 | |
| Financial Stability | 4 | |
| Dividend Continuity | 5 | |
| Cashflow Coverage | 4 | |
| Balance Sheet Quality | 4 |
Total Score: 33/40
✅ Rating
With a total score of 33 out of 40, Rollins, Inc. presents a strong dividend investment opportunity. The company's consistent history of dividend distributions and financial resilience highlights its appeal to conservative dividend-seeking investors.
Smart Data Insight
Master the Perfect Entry & Exit for this Stock
Don't leave your profits to chance. Historically, this stock follows specific seasonal patterns that institutional traders use to maximize returns.
- ✅ Identify the "Golden Buying Window"
- ✅ Avoid high-risk correction cycles
- ✅ Backtested data from the last 20+ years