December 13, 2025 a 04:03 am


ROK: Trend and Support & Resistance Analysis - Rockwell Automation, Inc.
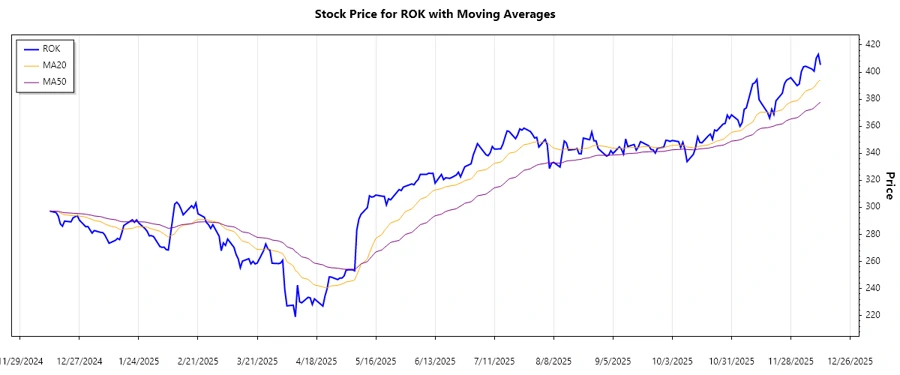
The stock of Rockwell Automation, Inc. shows significant volatility with trends reflecting industrial demands. Positioned globally, the firm's technology solutions are encouraging interest among investors. Recent months indicate fluctuations with potential growth in digital transformation sectors. Monitoring trend indicators could be crucial for potential investments. Understanding the latest trend dynamics provides insights into future market actions.
Trend Analysis
| Date | Closing Price | Trend |
|---|---|---|
| 2025-12-12 | $405.31 | ▲ Uptrend |
| 2025-12-11 | $413.05 | ▲ Uptrend |
| 2025-12-10 | $410.23 | ▲ Uptrend |
| 2025-12-09 | $400.61 | ▲ Uptrend |
| 2025-12-08 | $402.22 | ▲ Uptrend |
| 2025-12-05 | $404.29 | ▲ Uptrend |
| 2025-12-04 | $403.89 | ▲ Uptrend |
The current analysis reveals an uptrend with the EMA20 surpassing the EMA50 indicative of bullish momentum. This suggests a favorable investor sentiment in the near term.
Support and Resistance
| Zone | From | To |
|---|---|---|
| Support Zone 1 | $370 | $380 |
| Support Zone 2 | $390 | $400 |
| Resistance Zone 1 | $410 | $420 |
| Resistance Zone 2 | $425 | $435 |
The stock is currently inside the Resistance Zone 1, suggesting potential profit-taking or reversal. A breakout above this zone would indicate continued upward momentum.
Conclusion
Rockwell Automation, Inc. seems to be positioned for modest growth with its presence in crucial emerging sectors. While current trends reflect an upward trajectory, the proximity to resistance levels warrants caution for short-term investors. Furthermore, entering new markets provides longer-term prospects, though industry and general economic conditions remain influencing factors. Investors may consider diversifying within the tech sector to mitigate potential risks associated with market volatility and global uncertainties.