November 04, 2025 a 02:03 pm
ROK: Trend and Support & Resistance Analysis - Rockwell Automation, Inc.
Rockwell Automation, Inc. has shown significant price movements over the recent months, attributable to its focus on industrial automation. The company’s product segments enable it to cater to a diverse market, aiding in sustainable growth prospects. The technical analysis suggests a bullish momentum; however, investors must consider market volatility and global economic factors.
Trend Analysis
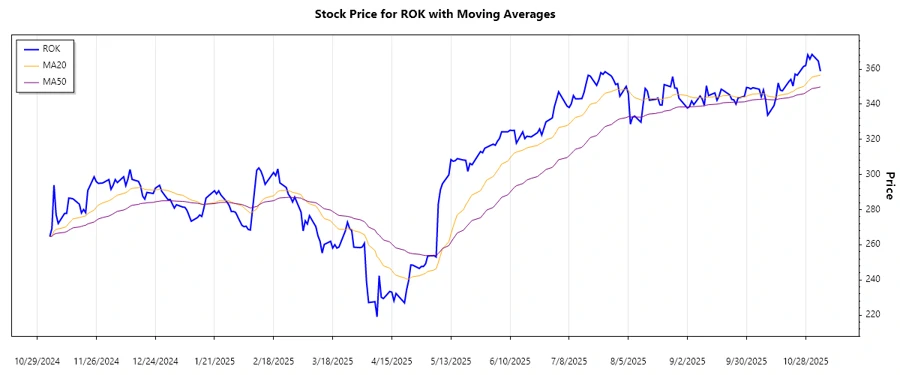
The analysis of Rockwell Automation's stock reveals a trend based on recent price movements. By calculating the 20-day (EMA20) and 50-day (EMA50) exponential moving averages, it's determined whether the stock is in an upward trend, downward trend, or sideways. The following table highlights the data for the last seven days.
| Date | Close Price | Trend |
|---|---|---|
| 2025-11-04 | $358.77 | ▲ |
| 2025-11-03 | $364.54 | ▲ |
| 2025-10-31 | $368.36 | ▲ |
| 2025-10-30 | $365.66 | ▲ |
| 2025-10-29 | $368.15 | ▲ |
| 2025-10-28 | $361.98 | ▲ |
| 2025-10-27 | $361.53 | ▲ |
The data denotes a general upward trend as depicted by the consistent increases in the closing prices over the past week.
Support and Resistance
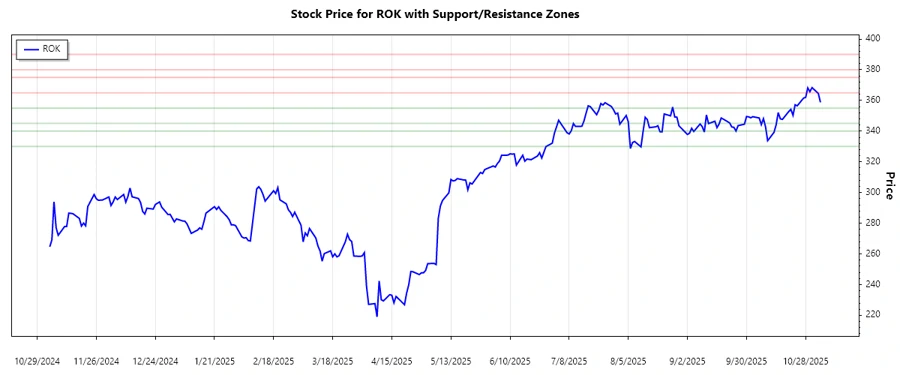
Through examining the stock price data of Rockwell Automation, critical support and resistance zones have been identified. These zones are pivotal in determining the stock's future price movements.
| Zone Type | From | To | |
|---|---|---|---|
| Support | $345.00 | $355.00 | ↘ |
| Support | $330.00 | $340.00 | ↘ |
| Resistance | $365.00 | $375.00 | ↗ |
| Resistance | $380.00 | $390.00 | ↗ |
The latest closing price positions Rockwell Automation near a resistance level, suggesting potential price testing in the $365-$375 range. This is a critical area to watch for any breakout or reversal.
Conclusion
The analysis of Rockwell Automation, Inc. indicates a strong upward trend, supported by consistent price gains and validating the company's industrial market position. Traders should watch the price interactions near identified resistance zones as potential breakout opportunities. However, macroeconomic uncertainties could influence price stability and must be factored into investment decisions. This findings suggest growth potential with the need for cautious monitoring due to broader market conditions.
Smart Data Insight
Master the Perfect Entry & Exit for this Stock
Don't leave your profits to chance. Historically, this stock follows specific seasonal patterns that institutional traders use to maximize returns.
- ✅ Identify the "Golden Buying Window"
- ✅ Avoid high-risk correction cycles
- ✅ Backtested data from the last 20+ years