
June 05, 2026 a 06:00 pm

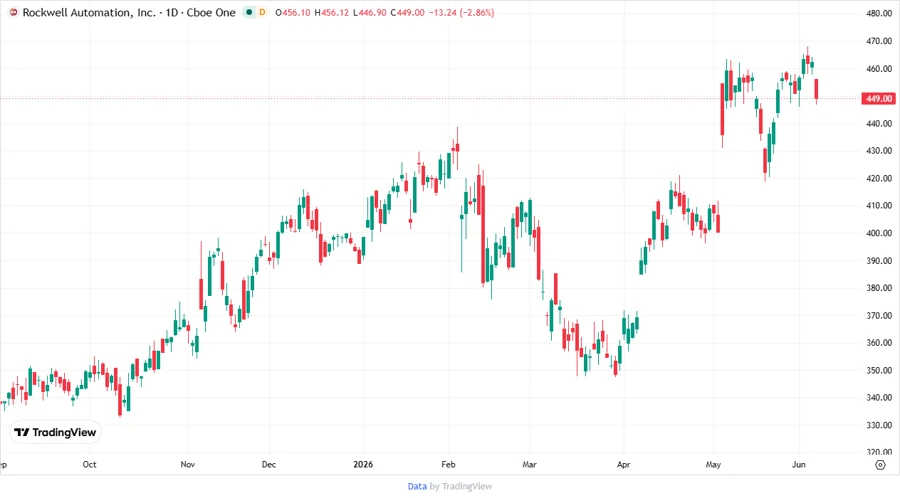
ROK: Fundamental Ratio Analysis - Rockwell Automation, Inc.
Rockwell Automation, Inc. (Ticker: ROK) appears well-positioned in the industrial automation and digital transformation market, catering to a diverse range of industries. The company is characterized by stable financials albeit with some challenges in capital efficiency compared to peers. Future growth prospects are bolstered by its innovation in automation solutions.
Fundamental Rating
The current fundamental analysis shows a moderate rating for Rockwell Automation. Its strengths lie in return metrics, while the debt-to-equity ratio is a point of concern.
| Category | Score | Visualization |
|---|---|---|
| Overall | 3 | |
| Discounted Cash Flow | 3 | |
| Return on Equity | 5 | |
| Return on Assets | 5 | |
| Debt to Equity | 1 | |
| Price to Earnings | 2 | |
| Price to Book | 1 |
Historical Rating
The historical performance indicates that the company's scores have been stable over recent periods.
| Date | Overall | DCF | ROE | ROA | Debt/Equity | P/E | P/B |
|---|---|---|---|---|---|---|---|
| 2026-06-05 | 3 | 3 | 5 | 5 | 1 | 2 | 1 |
| Previous | 0 | 3 | 5 | 5 | 1 | 2 | 1 |
Analyst Price Targets
Analysts maintain a consensus to hold, with the price target spreading between $410 and $525.
| High | Low | Median | Consensus |
|---|---|---|---|
| $525 | $410 | $459 | $464.75 |
Analyst Sentiment
Analyst sentiment reveals that the stock is predominantly held, with no strong buyer's consensus.
| Recommendation | Count | Distribution |
|---|---|---|
| Strong Buy | 0 | |
| Buy | 12 | |
| Hold | 25 | |
| Sell | 2 | |
| Strong Sell | 0 |
Conclusion
Rockwell Automation, Inc. is a stable company with promising prospects in industrial automation and digital transformation. Despite some challenges with debt levels, the company's innovative solutions and wide-ranging market presence underpin potential growth. The stock is currently rated as 'Hold' by analysts, suggesting a cautious but potentially rewarding investment. Investors should weigh the high price target range against the company's strategic initiatives and evolving industry trends.
Smart Data Insight
Master the Perfect Entry & Exit for this Stock
Don't leave your profits to chance. Historically, this stock follows specific seasonal patterns that institutional traders use to maximize returns.
- ✅ Identify the "Golden Buying Window"
- ✅ Avoid high-risk correction cycles
- ✅ Backtested data from the last 20+ years