June 30, 2026 a 10:15 am

ROK: Fibonacci Analysis - Rockwell Automation, Inc.
Rockwell Automation, Inc. has experienced a strong upward trend over recent months, showing resilience amidst market fluctuations. With its diversified product offerings within the industrial automation and digital transformation sectors, the company continues to appeal to a broad range of industries. However, investors should monitor the stock’s performance for potential retracement levels that may indicate future support or resistance points.
Fibonacci Analysis
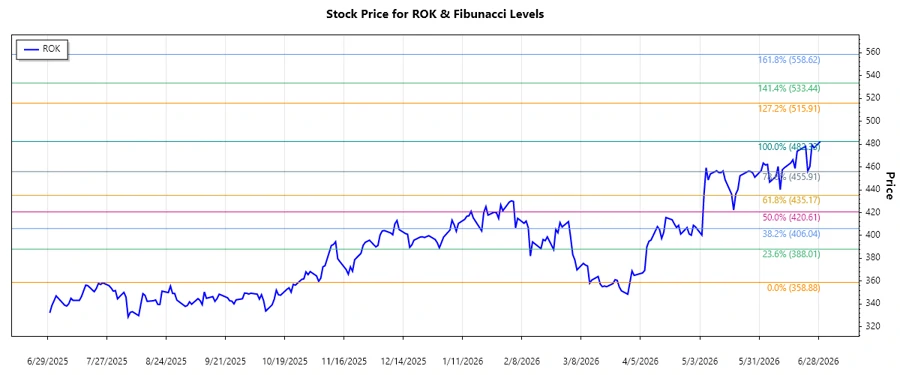
Based on the historical review from March 2, 2026, to June 29, 2026, Rockwell Automation has demonstrated a solid upward trend with significant price movement. The analysis identifies critical Fibonacci retracement levels that forecast potential support or resistance areas.
| Trend Period | High Point | Low Point | Fibonacci Levels | Current Position | Technical Interpretation |
|---|---|---|---|---|---|
| 2026-03-02 to 2026-06-29 | $482.33 (2026-06-29) | $358.88 (2026-03-31) |
|
None | The current price remains above the highest Fibonacci level (0.786) at $482.33, indicating a continuation of the bullish trend without significant retracements. |
Conclusion
The current trend for Rockwell Automation, Inc. indicates a bullish market sentiment, with prices exceeding key Fibonacci levels, showing strong growth potential. Investors might consider this as a continued growth opportunity, but should remain vigilant for market corrections. A careful watch on fundamental company changes in industrial automation and external market conditions could present both opportunities and risks. The lack of recent price retracement suggests strong market confidence, yet the future may hold unpredictable challenges. For technical analysts, this high position offers insight into potential support levels, useful for strategic decision-making.
Smart Data Insight
Master the Perfect Entry & Exit for this Stock
Don't leave your profits to chance. Historically, this stock follows specific seasonal patterns that institutional traders use to maximize returns.
- ✅ Identify the "Golden Buying Window"
- ✅ Avoid high-risk correction cycles
- ✅ Backtested data from the last 20+ years