November 16, 2025 a 06:44 am
ROK: Fibonacci Analysis - Rockwell Automation, Inc.
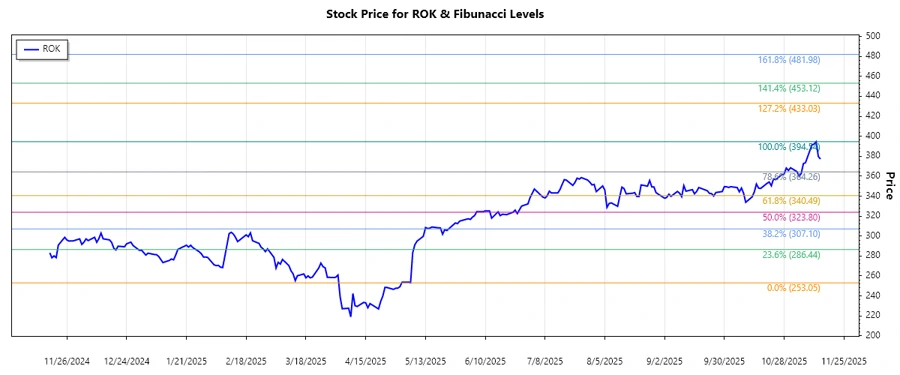
Rockwell Automation, Inc. has been showing a strong uptrend over the past few months. The company operates in a dynamic industrial automation space providing vital solutions that cater to various sectors. Recent price movements suggest that the stock has reached new highs, and a technical analysis could provide insights into possible support and resistance levels.
Fibonacci Analysis
| Aspect | Details |
|---|---|
| Start Date | 2025-05-06 |
| End Date | 2025-11-12 |
| High Point (Price and Date) | $394.54 on 2025-11-12 |
| Low Point (Price and Date) | $253.05 on 2025-05-06 |
| Fibonacci Levels |
|
| Current Price Retracement | 0.236 - Based on the latest data, the current price is within the 0.236 Fibonacci retracement level. |
| Technical Interpretation | The current retracement zone suggests potential support at the 0.236 level, indicating a possible rebound if the price holds. |
Conclusion
Rockwell Automation, Inc.'s stock has been on a notable uptrend backed by their strong presence in manufacturing automation. Current analysis shows the stock is in a retracement level, providing potential support. However, if the price falls below this level, it may indicate a trend reversal or further price corrections. Investors should remain cautious, as market volatility can impact price stability. On the positive end, firm industrial demand and digital transformation initiatives offer robust growth opportunities. Continuous monitoring of the Fibonacci levels can offer additional insights for potential entry or exit points in this dynamic sector.
Smart Data Insight
Master the Perfect Entry & Exit for this Stock
Don't leave your profits to chance. Historically, this stock follows specific seasonal patterns that institutional traders use to maximize returns.
- ✅ Identify the "Golden Buying Window"
- ✅ Avoid high-risk correction cycles
- ✅ Backtested data from the last 20+ years