May 07, 2026 a 07:31 am
ROK: Dividend Analysis - Rockwell Automation, Inc.
Rockwell Automation, Inc. demonstrates a steady and promising dividend profile. With 45 consecutive years of dividend payment, their historical stability marks a hallmark of financial reliability. Investors may find the moderate yield appealing, underscoring the company’s commitment to shareholder returns. The absence of any recent dividend cuts is reassuring, reflecting robust corporate health and strategic financial management.
📊 Overview
Rockwell Automation, Inc.’s key financial statistics present an insight into its dividend payout and sustainability.
| Sector | Dividend Yield | Current Dividend Per Share | Dividend History | Last Cut or Suspension |
|---|---|---|---|---|
| Industrial Machinery | 1.19% | 5.24 USD | 45 years | None |
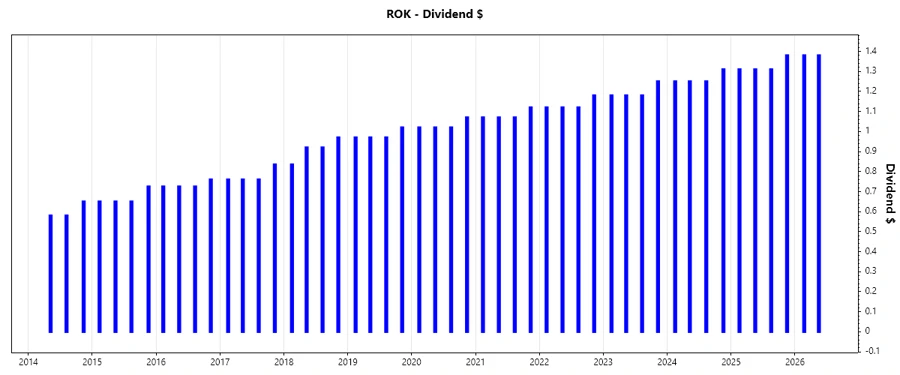
🗣️ Dividend History
Understanding the dividend history is crucial as it showcases a company's stability and its commitment to returning value to shareholders. A consistent dividend history can enhance investor confidence.
| Year | Dividend Per Share (USD) |
|---|---|
| 2026 | 2.76 |
| 2025 | 5.31 |
| 2024 | 5.06 |
| 2023 | 4.79 |
| 2022 | 4.54 |
📈 Dividend Growth
Dividend growth provides an indication of how a company can amplify returns to shareholders over time. It often implies how earnings and management decisions align with shareholder interest.
| Time | Growth |
|---|---|
| 3 years | 5.36% |
| 5 years | 5.15% |
The average dividend growth is 5.15% over 5 years. This shows moderate but steady dividend growth.
📉 Payout Ratio
Payout ratios are essential to determine sustainability. They illustrate how much of a company’s earnings and cash flow are directed toward dividend payments.
| Key Figure | Ratio |
|---|---|
| EPS-based | 54.03% |
| Free cash flow-based | 44.00% |
A payout ratio of 54.03% (EPS) and 44.00% (FCF) suggests Rockwell maintains a balanced approach in its dividend strategy, ensuring sufficient reinvestment into the business while rewarding shareholders.
✅ Cashflow & Capital Efficiency
Analyzing cash flows and capital efficiency is essential for understanding ongoing operations and financial health. They reflect the capacity of a company to maintain or grow dividends.
| Metrics | 2023 | 2024 | 2025 |
|---|---|---|---|
| Free Cash Flow Yield | 2.59% | 3.50% | 3.44% |
| Earnings Yield | 2.11% | 3.11% | 2.21% |
| CAPEX to Operating Cash Flow | 12.77% | 26.01% | 12.05% |
| Stock-based Compensation to Revenue | -0.67% | 1.21% | 1.02% |
| Free Cash Flow / Operating Cash Flow Ratio | 87.95% | 73.99% | 87.95% |
Rockwell's cashflow stability and capital efficiency demonstrate sound financial management practices, ensuring sustained dividend payouts and growth potential.
⚠️ Balance Sheet & Leverage Analysis
The balance sheet and leverage ratios reveal Rockwell's financial structure and borrowing levels, critically influencing its risk profile and capacity for dividend continuity.
| Metrics | 2023 | 2024 | 2025 |
|---|---|---|---|
| Debt-to-Equity Ratio | 0.94 | 1.17 | 0.99 |
| Debt-to-Assets Ratio | 0.30 | 0.36 | 0.33 |
| Debt-to-Capital Ratio | 0.48 | 0.54 | 0.50 |
| Net Debt to EBITDA | 1.13 | 2.31 | 2.27 |
| Current Ratio | 1.46 | 1.08 | 1.14 |
| Quick Ratio | 1.04 | 0.72 | 0.77 |
| Financial Leverage | 3.17 | 3.21 | 3.07 |
Rockwell's financial ratios suggest solid financial stability with moderate leverage, providing confidence in its ability to sustain and grow dividend payments.
🚀 Fundamental Strength & Profitability
These metrics evaluate how efficiently Rockwell operates and utilizes its assets in generating profit, which ultimately funds dividend distributions.
| Metrics | 2023 | 2024 | 2025 |
|---|---|---|---|
| Return on Equity | 38.95% | 27.23% | 23.78% |
| Return on Assets | 12.27% | 8.48% | 7.75% |
| Net Margin | 15.32% | 11.53% | 10.42% |
| EBIT Margin | 19.25% | 15.13% | 12.86% |
| EBITDA Margin | 22.02% | 18.97% | 16.76% |
| Gross Margin | 41.04% | 44.52% | 48.14% |
| R&D to Revenue | 5.85% | 5.78% | 5.87% |
High profitability ratios indicate strong operational efficiency at Rockwell, supporting sustainable dividends even during economic downturns.
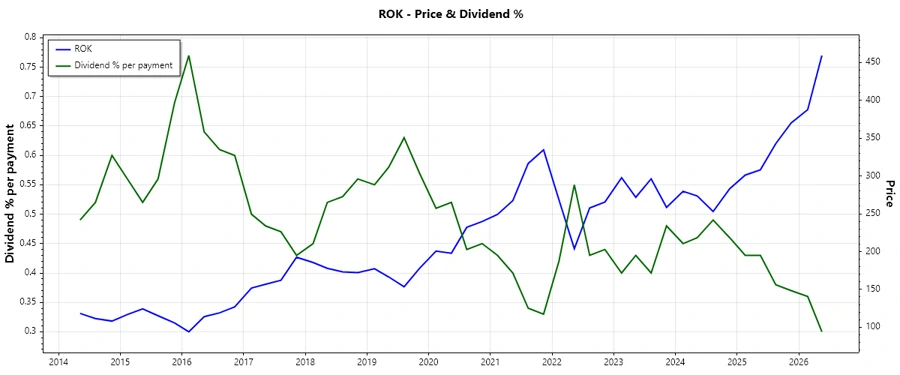
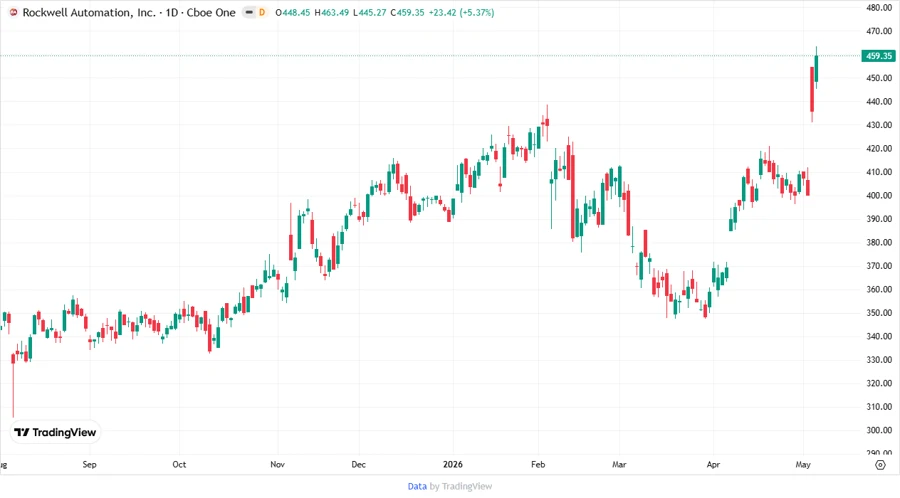
📅 Price Development
🏆 Dividend Scoring System
| Criteria | Score | Score Bar |
|---|---|---|
| Dividend Yield | 4 | |
| Dividend Stability | 5 | |
| Dividend Growth | 3 | |
| Payout Ratio | 4 | |
| Financial Stability | 4 | |
| Dividend Continuity | 5 | |
| Cashflow Coverage | 4 | |
| Balance Sheet Quality | 4 |
Total Score: 33 / 40
🔍 Rating
Rockwell Automation, Inc. exhibits consistent financial and dividend operations, reflected by its substantial dividend history and minimal leverage. The stock is rated as a reliable candidate for dividend-focused portfolios, especially for those seeking security with moderate growth potential.
Smart Data Insight
Master the Perfect Entry & Exit for this Stock
Don't leave your profits to chance. Historically, this stock follows specific seasonal patterns that institutional traders use to maximize returns.
- ✅ Identify the "Golden Buying Window"
- ✅ Avoid high-risk correction cycles
- ✅ Backtested data from the last 20+ years