November 28, 2025 a 07:31 am


ROK: Dividend Analysis - Rockwell Automation, Inc.
Rockwell Automation, Inc. has demonstrated a commendable history of dividend payments, cementing its reputation as a stable dividend provider. Despite a modest current dividend yield of 1.43%, the firm's commitment to dividends is longstanding, with an impressive track record of 44 years of continuous dividends. Noteworthy is the last dividend cut which happened in 2002, suggesting resilience even during market vicissitudes.
📊 Overview
Rockwell Automation operates in the industrial automation and information technology sector, a domain poised for growth thanks to Industry 4.0 trends. The dividend yield stands at 1.43%, reflecting stability amidst moderate growth. The company has been paying dividends uninterrupted for 44 years.
| Metric | Value |
|---|---|
| Sector | Industrial Automation |
| Dividend yield | 1.43% |
| Current dividend per share | 0 USD |
| Dividend history | 44 years |
| Last cut or suspension | 2002 |
📈 Dividend History
Rockwell Automation's dividend history is significant, as it showcases the company's long-term commitment to returning value to its shareholders. This consistency is crucial for income-focused investors.
| Year | Dividend per Share (USD) |
|---|---|
| 2025 | 5.31 |
| 2024 | 5.06 |
| 2023 | 4.79 |
| 2022 | 4.54 |
| 2021 | 4.33 |
📈 Dividend Growth
Dividend growth analysis indicates the company's commitment to enhancing shareholder value over time. This metric is essential as it reflects the company's growth strategy and financial health.
| Time | Growth |
|---|---|
| 3 years | 5.33% |
| 5 years | 5.18% |
The average dividend growth is 5.18% over 5 years. This shows moderate but steady dividend growth.
📈 Payout Ratio
The payout ratio is a key indicator of how much of a company's earnings are being returned to shareholders in the form of dividends. It's crucial to assess both EPS-based and free cash flow payout ratios to determine sustainability.
| Key figure | Ratio |
|---|---|
| EPS-based | 0% |
| Free cash flow-based | 0% |
The EPS payout ratio of 0% and the FCF payout ratio of 0% indicate that the company might have paused dividends recently or using its earnings and cash flow for reinvestment or debt management.
🔍 Cashflow & Capital Efficiency
Understanding cash flow and capital efficiency is pivotal in analyzing a company's ability to fund dividends and expansions. It reflects operational excellence and financial discipline.
| Year | 2025 | 2024 | 2023 |
|---|---|---|---|
| Free Cash Flow Yield | 0 | 2.09% | 3.70% |
| Earnings Yield | 0 | 3.11% | 4.21% |
| CAPEX/Operating Cash Flow | 0.12 | 0.26 | 0.12 |
| Stock-based Compensation to Revenue | 0 | 1.21% | 0.98% |
| Free Cash Flow/Operating Cash Flow | 0.88 | 0.74 | 0.88 |
The company's free cash flow and operational cash flow metrics suggest a well-managed cash position and prudent capital allocation strategy.
🔍 Balance Sheet & Leverage Analysis
Analyzing leverage and balance sheet health offers insights into the company's financial resilience and creditworthiness. A strong balance sheet often supports consistent dividend payments.
| Year | 2025 | 2024 | 2023 |
|---|---|---|---|
| Debt-to-Equity | 0.97 | 1.17 | 0.94 |
| Debt-to-Assets | 0.32 | 0.36 | 0.30 |
| Debt-to-Capital | 0.49 | 0.54 | 0.48 |
| Net Debt to EBITDA | 0 | 2.31 | 1.14 |
| Current Ratio | 2.37 | 1.08 | 1.46 |
| Quick Ratio | 1.56 | 0.72 | 1.04 |
| Financial Leverage | 3.07 | 3.21 | 3.17 |
The company's leverage ratios remain within acceptable bounds, reflecting sound debt management practices and liquidity adequate to meet short-term obligations.
🔍 Fundamental Strength & Profitability
Understanding fundamental strength and profitability is key to assessing the overall health and long-term growth prospects of the company. High margins and returns typically signify strong market positioning.
| Year | 2025 | 2024 | 2023 |
|---|---|---|---|
| Return on Equity | 0 | 27.23% | 38.79% |
| Return on Assets | 0 | 8.48% | 12.22% |
| Margins: Net, EBIT, EBITDA, Gross | 0 | 11.53%, 15.13%, 18.97%, 44.52% | 15.26%, 19.23%, 21.99%, 46.46% |
| Research & Development to Revenue | 0 | 5.78% | 5.85% |
The company's profitability metrics point towards effective operations and competitive advantages in its sector, supporting a positive outlook on continued profitability.
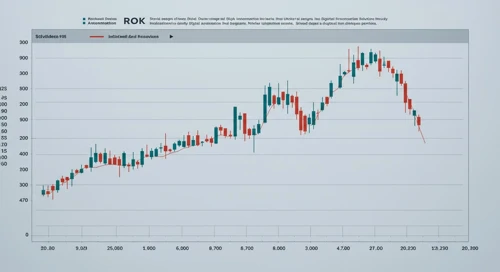
📉 Price Development
✅ Dividend Scoring System
| Criterion | Score | |
|---|---|---|
| Dividend yield | 2 | |
| Dividend Stability | 5 | |
| Dividend growth | 3 | |
| Payout ratio | 1 | |
| Financial stability | 4 | |
| Dividend continuity | 5 | |
| Cashflow Coverage | 4 | |
| Balance Sheet Quality | 4 |
Total Score: 28/40
⭐ Rating
Rockwell Automation, Inc. has exhibited strong aspects of stability and moderate growth potential in dividends, making it an attractive option for conservative income investors. With a total dividend score of 28 out of 40, the firm provides a solid blend of safety and modest growth. Long-term investors can consider it a worthy component of a diversified dividend portfolio due to its commitment to maintaining payouts and strong financial fundamentals.