May 21, 2026 a 04:03 am

RMD: Trend and Support & Resistance Analysis - ResMed Inc.
The ResMed Inc. stock has shown some fluctuations, suggesting a volatile yet strategically important position in the healthcare market. With advanced offerings in both the sleep and respiratory care domains, ResMed is well-positioned in numerous international markets. Recent data indicates potential trends worth monitoring, especially concerning its cloud-based solutions that could bolster its market position.
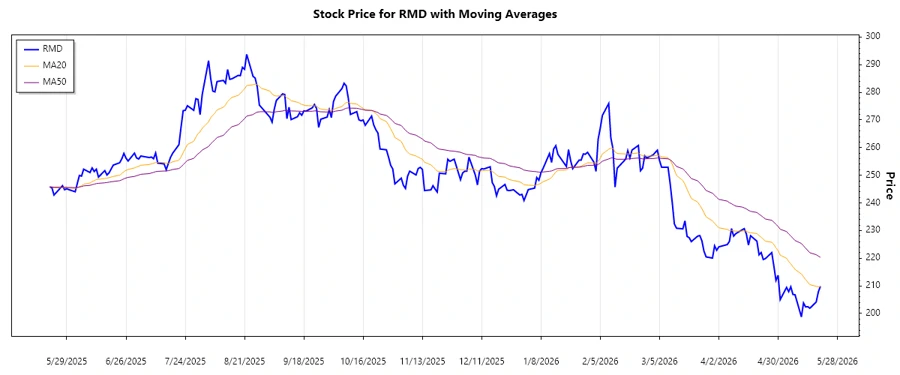
Trend Analysis
Based on the recent analysis of ResMed Inc.'s stock prices, we are observing a nuanced market behavior. By calculating the EMA20 and EMA50, the trend can be interpreted effectively. Recent data suggests movement between these two EMAs, providing insights into the overall market sentiment.
| Date | Closing Price | Trend |
|---|---|---|
| 2026-05-20 | 209.86 | ▼ |
| 2026-05-19 | 207.78 | ▼ |
| 2026-05-18 | 204.15 | ▼ |
| 2026-05-15 | 201.88 | ▼ |
| 2026-05-14 | 202.46 | ⚖️ |
| 2026-05-13 | 202.37 | ⚖️ |
| 2026-05-12 | 203.79 | ⚖️ |
The recent trend indicates a general downward pressure with occasional stability phases, suggesting caution for potential investors.
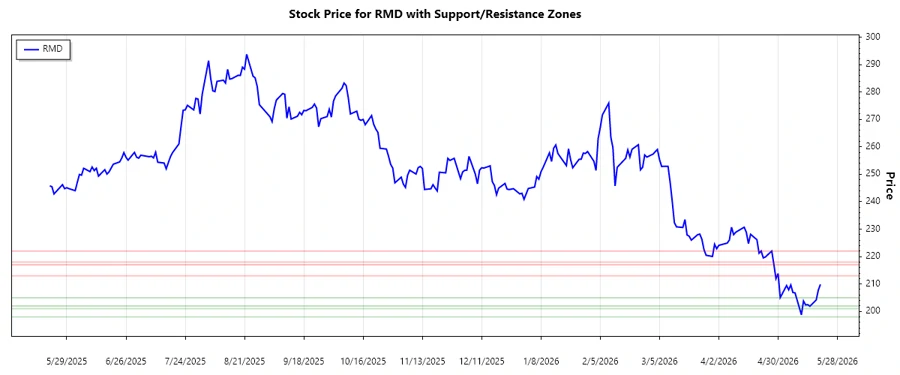
Support and Resistance
Analyzing the support and resistance levels, ResMed Inc.'s stock shows defined zones that can influence trading decisions. Here are the calculated support and resistance zones:
| Zone | From | To | |
|---|---|---|---|
| Support 1 | 201.00 | 205.00 | ▼ |
| Support 2 | 198.00 | 202.00 | ▼ |
| Resistance 1 | 213.00 | 217.00 | ▲ |
| Resistance 2 | 218.00 | 222.00 | ▲ |
Currently, the stock resides near its support zone, hinting at potential upward corrections if buying pressure increases.
Conclusion
ResMed Inc. exhibits a complex trading pattern, with identifiable support and resistance levels providing crucial insights for traders. While the stock is currently facing downward pressure, its strategic offerings in healthcare could spur an upwards shift. Traders should remain cautious, considering macroeconomic factors and market sentiment, while potential investors might look for opportunities near the support zones to capitalize on potential growth.
Smart Data Insight
Master the Perfect Entry & Exit for this Stock
Don't leave your profits to chance. Historically, this stock follows specific seasonal patterns that institutional traders use to maximize returns.
- ✅ Identify the "Golden Buying Window"
- ✅ Avoid high-risk correction cycles
- ✅ Backtested data from the last 20+ years