
May 23, 2025 a 12:22 pmRMD: Trend and Support & Resistance Analysis - ResMed Inc.


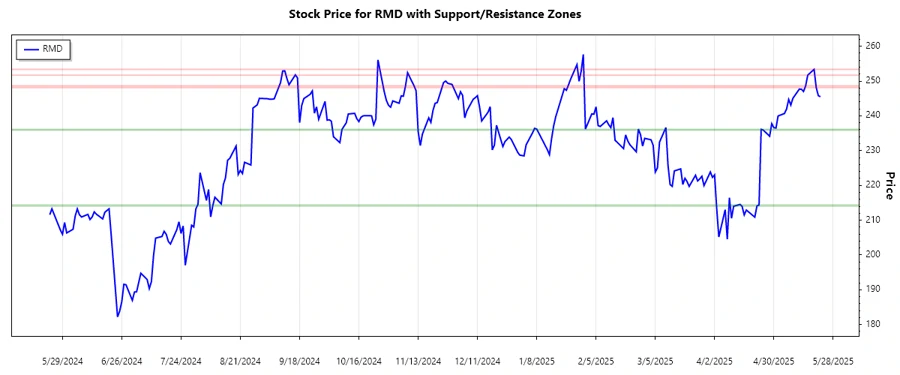
ResMed Inc. is a prominent player in the healthcare sector, specializing in medical devices and software solutions for respiratory disorders. Despite facing market volatility, the company demonstrates robust fundamentals. Analyzing recent stock performance highlights crucial insights into investor sentiment and potential future movements. Understanding the technical trends and support-resistance levels can provide strategic advantages in making informed decisions.
Trend Analysis
| Date | Close Price | Trend |
|---|---|---|
| 2025-05-22 | 245.49 | ▼ |
| 2025-05-21 | 245.78 | ▼ |
| 2025-05-20 | 248.14 | ▼ |
| 2025-05-19 | 253.35 | ▲ |
| 2025-05-16 | 251.69 | ▼ |
| 2025-05-15 | 248.58 | ▼ |
| 2025-05-14 | 246.99 | ▼ |
The EMA20 is lower than the EMA50, reflecting a dominant downward trend in the short term. Investors should be cautious as a continuation of this pattern may indicate further declines.
Support- and Resistance
| Type | From | To | |
|---|---|---|---|
| Support Zone 1 | 214.36 | 214.08 | └ |
| Support Zone 2 | 235.88 | 236.1 | └ |
| Resistance Zone 1 | 248.14 | 253.35 | ┌ |
| Resistance Zone 2 | 251.69 | 248.58 | ┌ |
Current price activity suggests consolidation near the lower support. Should the price hold, it may signify a potential reversal. Otherwise, penetration of the support zones may lead to further weakness.
Conclusion
The analysis indicates the ResMed Inc. stock is in a downtrend, as signaled by the EMAs. Current levels are approaching significant support zones, which could serve as a turning point if steadied. risks include possible continued downward pressure, while opportunities lie in potential support stabilization or reversal. Understanding these dynamics is crucial for analysts forecasting possible scenarios and strategizing entry or exit points in line with market behavior.
Smart Data Insight
Master the Perfect Entry & Exit for this Stock
Don't leave your profits to chance. Historically, this stock follows specific seasonal patterns that institutional traders use to maximize returns.
- ✅ Identify the "Golden Buying Window"
- ✅ Avoid high-risk correction cycles
- ✅ Backtested data from the last 20+ years