May 21, 2026 a 11:44 am
RMD: Fibonacci Analysis - ResMed Inc.
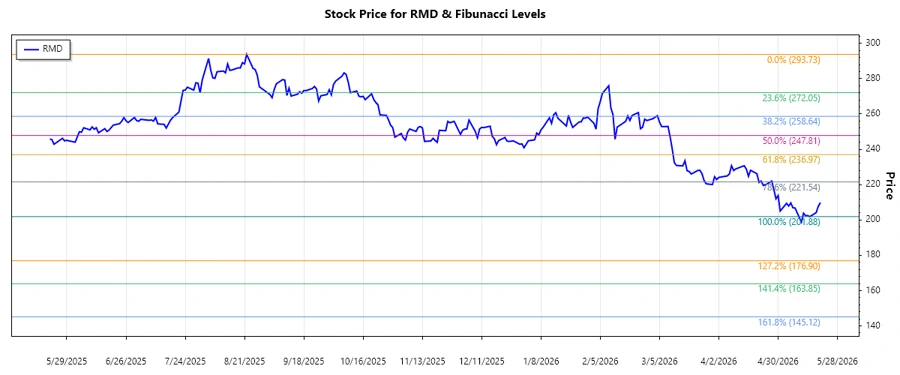
ResMed Inc.'s stock (RMD) has shown a noticeable downtrend in the past months, reflecting an evolving market sentiment towards healthcare device companies. As a notable provider of medical devices and software solutions worldwide, ResMed's stock performance is pivotal in understanding market reactions to broader industry changes. Based on our technical analysis using Fibonacci retracement, the recent price activities indicate potential levels where the price may experience support or resistance.
Fibonacci Analysis
| Analysis Parameter | Details |
|---|---|
| Trend Duration | 2025-08-22 to 2026-05-20 |
| Highest Price Point | $293.73 on 2025-08-22 |
| Lowest Price Point | $201.88 on 2026-05-15 |
| Current Price | $209.86 |
| 23.6% Fibonacci Level | $222.58 |
| 38.2% Fibonacci Level | $235.61 |
| 50% Fibonacci Level | $247.81 |
| 61.8% Fibonacci Level | $260.01 |
| 78.6% Fibonacci Level | $277.20 |
| Current Retracement Zone | None (Below 23.6% level) |
| Interpretation | The stock is well below the 23.6% Fibonacci retracement level, indicating the presence of strong bearish momentum. Watching for potential support or reversal near these levels is crucial for buyers. |
Conclusion
ResMed Inc.'s recent stock price movements demonstrate a significant downtrend, presenting both challenges and opportunities for investors. The technical analysis highlights ResMed's struggle to maintain higher price levels, which may reflect broader market conditions and specific sector challenges. As the stock trades below key Fibonacci retracement levels, cautious optimism is recommended for potential bounce-back scenarios. Traders and analysts should keep an eye on external market impacts and company-specific news that could influence stock recovery. Overall, while the recent downtrend has been pronounced, any signs of reversal at the current levels must be closely monitored for trading opportunities.
Smart Data Insight
Master the Perfect Entry & Exit for this Stock
Don't leave your profits to chance. Historically, this stock follows specific seasonal patterns that institutional traders use to maximize returns.
- ✅ Identify the "Golden Buying Window"
- ✅ Avoid high-risk correction cycles
- ✅ Backtested data from the last 20+ years