January 02, 2026 a 07:46 am
RMD: Dividend Analysis - ResMed Inc.
ResMed Inc. presents a modest dividend yield but boasts a track record of consistent dividend payments over 14 years without any cuts or suspensions. Despite a lower yield of 0.89%, the company demonstrates sustainable dividend growth and a conservative payout ratio, which positions it as a potentially stable income generator for long-term investors seeking gradual income growth alongside capital appreciation.
Overview 📊
ResMed Inc. operates in the Healthcare sector, with a market focus on sleep-related disorders and respiratory care. The company's financial stability and consistent dividend policy present a promising outlook for income-seeking investors.
| Metric | Details |
|---|---|
| Sector | Healthcare |
| Dividend Yield | 0.90% |
| Current Dividend Per Share | $2.12 |
| Dividend History | 14 years |
| Last Cut or Suspension | None |
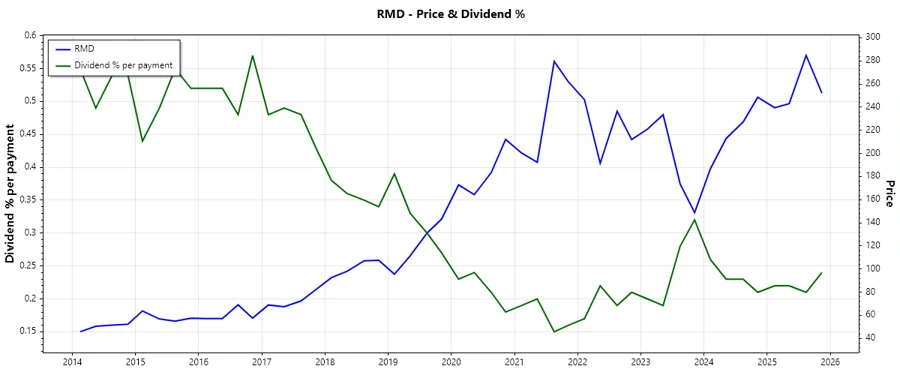
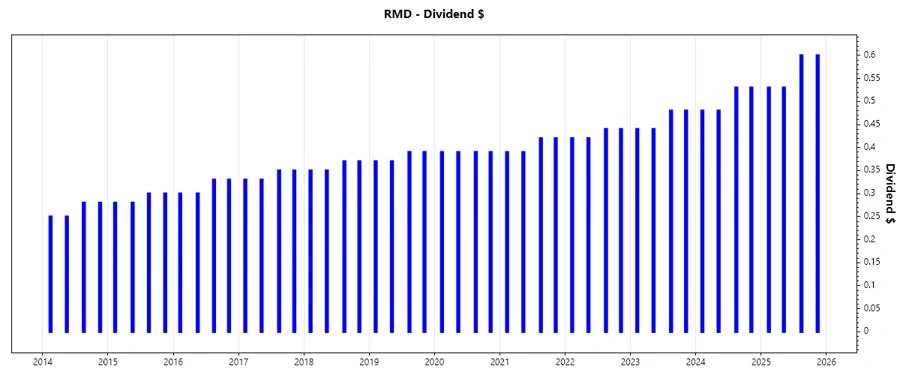
Dividend History 🗣️
Historical dividend payments reinforce investor confidence in ResMed's enduring commitment to shareholder returns. The company's ability to consistently increase dividend payouts reflects its robust financial health and strategic growth initiatives.
| Year | Dividend Per Share (USD) |
|---|---|
| 2025 | 2.26 |
| 2024 | 2.02 |
| 2023 | 1.84 |
| 2022 | 1.72 |
| 2021 | 1.62 |
Dividend Growth 📈
ResMed's dividend growth over the last few years underscores its strong earnings generation and prudent capital allocation policies. The growth rates are indicative of its ability to enhance shareholder value progressively.
| Time | Growth |
|---|---|
| 3 years | 9.53% |
| 5 years | 7.70% |
The average dividend growth is 7.70% over 5 years. This shows moderate but steady dividend growth, reinforcing ResMed's capacity for enhanced shareholder distributions.
Payout Ratio ⚠️
A low payout ratio indicates that ResMed retains a substantial portion of its earnings, which can be reinvested to foster growth and sustain future dividend payments.
| Key figure | Ratio |
|---|---|
| EPS-based | 21.58% |
| Free cash flow-based | 17.57% |
The EPS payout ratio of 21.58% and FCF payout ratio of 17.57% suggest ResMed's dividends are sustainable, as it signifies ample earnings are retained for operational and strategic pursuits.
Cashflow & Capital Efficiency 📈
Robust cashflow management is essential for sustaining dividends, indicating efficiency in capital allocation and the capability to navigate economic fluctuations while upholding investor confidence.
| Metric | 2025 | 2024 | 2023 |
|---|---|---|---|
| Free Cash Flow Yield | 4.39% | 4.68% | 1.74% |
| Earnings Yield | 3.70% | 3.71% | 2.80% |
| CAPEX to Operating Cash Flow | 5.13% | 8.20% | 19.33% |
| Stock-based Compensation to Revenue | 1.78% | 1.71% | 1.68% |
| Free Cash Flow/Operating Cash Flow Ratio | 94.87% | 91.80% | 80.67% |
The cashflow metrics depict ResMed's solid financial foundation, with strong FCF conversion and efficient spending on capital investments.
Balance Sheet & Leverage Analysis 📉
Evaluating leverage ratios helps assess ResMed's financial stability and its ability to manage debt while maintaining liquidity and minimizing financial risk exposure.
| Metric | 2025 | 2024 | 2023 |
|---|---|---|---|
| Debt-to-Equity | 14.27% | 17.97% | 38.26% |
| Debt-to-Assets | 10.42% | 12.72% | 23.40% |
| Debt-to-Capital | 12.49% | 15.23% | 27.67% |
| Net Debt to EBITDA | -0.19 | 0.41 | 0.99 |
| Current Ratio | 3.44 | 2.59 | 3.12 |
| Quick Ratio | 2.53 | 1.69 | 1.81 |
| Financial Leverage | 1.37 | 1.41 | 1.63 |
The debt metrics indicate a conservative financial structure, supported by a high current and quick ratio, suggesting strong liquidity management and low leverage dependency.
Fundamental Strength & Profitability ✅
Superior profitability and robust fundamental performance drive long-term shareholder value and fortify corporate stability, assuring investors of enduring corporate growth potential.
| Metric | 2025 | 2024 | 2023 |
|---|---|---|---|
| Return on Equity | 23.47% | 20.99% | 21.73% |
| Return on Assets | 17.14% | 14.86% | 13.29% |
| Net Margin | 27.22% | 21.79% | 21.25% |
| EBIT Margin | 32.60% | 27.97% | 27.52% |
| EBITDA Margin | 37.18% | 32.73% | 32.18% |
| Gross Margin | 59.36% | 56.67% | 55.78% |
| Research & Development to Revenue | 6.45% | 6.56% | 6.81% |
ResMed's margins and returns reflect a business of high profitability and operational efficiency, indicating strong competitive positioning and innovative capacity.
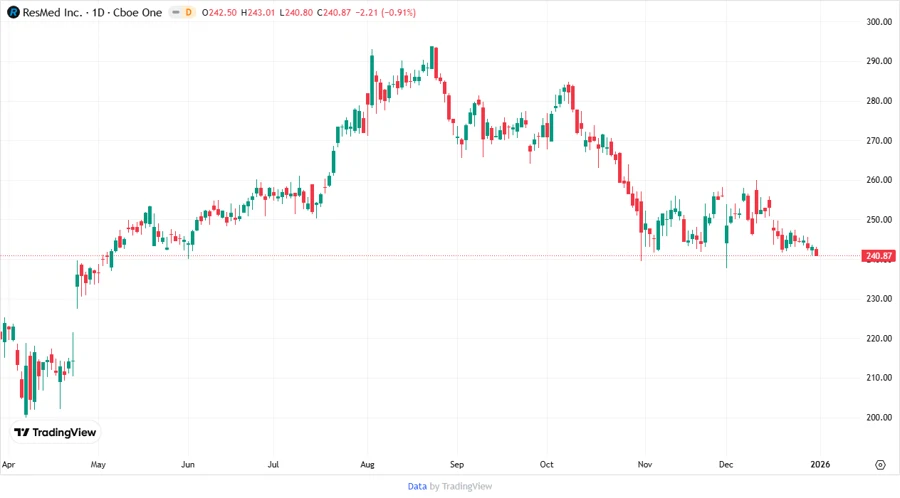
Price Development 📉
Dividend Scoring System 📊
| Category | Score (out of 5) | Score Bar |
|---|---|---|
| Dividend Yield | 2 | |
| Dividend Stability | 5 | |
| Dividend Growth | 4 | |
| Payout Ratio | 5 | |
| Financial Stability | 4 | |
| Dividend Continuity | 5 | |
| Cashflow Coverage | 4 | |
| Balance Sheet Quality | 5 |
Overall Score: 34 out of 40
Rating ✅
Based on the comprehensive analysis of ResMed Inc.'s dividend profile, the company presents itself as a financially sound investment, offering consistent income with a promising dividend growth trajectory. Its conservative financial management and robust cash flow enable sustained payouts, making it suitable for investors seeking steady, long-term income.