September 27, 2025 a 03:32 pm
RMD: Dividend Analysis - ResMed Inc.
ResMed Inc. presents a modest dividend profile with steady growth potential. With a dividend history of 14 years, the company has demonstrated resilience in its payout policy. ResMed’s financial efficiency and strong balance sheet underscore its ability to maintain dividend stability, despite a relatively low yield.
📊 Overview
ResMed Inc. operates within the healthcare sector, offering a compelling, albeit modest, dividend yield. The company’s consistent dividend history over 14 years highlights its commitment to returning value to shareholders. There have been no recent cuts or suspensions, indicating a stable dividend policy.
| Metric | Value |
|---|---|
| Sector | Healthcare |
| Dividend yield | 0.77 % |
| Current dividend per share | 2.12 USD |
| Dividend history | 14 years |
| Last cut or suspension | None |
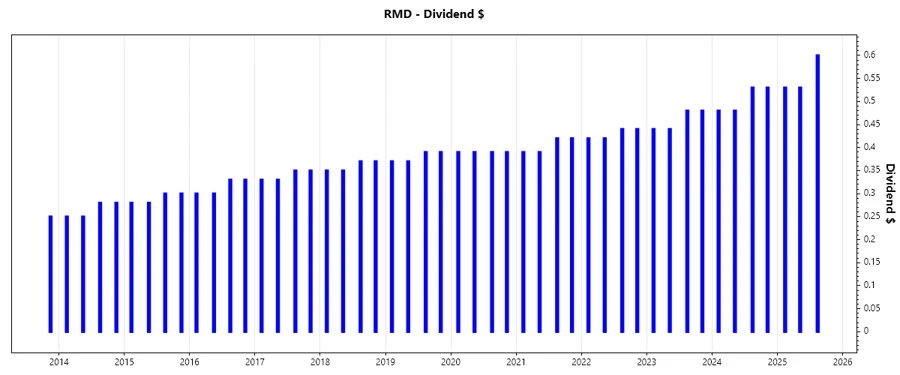
📈 Dividend History
Examining the dividend history provides insights into the company’s commitment to returning capital to shareholders. Over the past five years, ResMed has shown a pattern of consistent dividend increases, which reflects its progressive financial performance and strategic policy.
| Year | Dividend per Share (USD) |
|---|---|
| 2025 | 1.66 |
| 2024 | 2.02 |
| 2023 | 1.84 |
| 2022 | 1.72 |
| 2021 | 1.62 |
📉 Dividend Growth
Dividend growth reflects the company's ability to increase payouts to shareholders consistently. With a 3-year growth rate of 7.63 % and a 5-year growth rate of 5.85 %, ResMed displays a solid track record of increasing its dividends, showcasing its earning potential and financial health.
| Time | Growth |
|---|---|
| 3 years | 7.63 % |
| 5 years | 5.85 % |
The average dividend growth is 5.85 % over 5 years. This shows moderate but steady dividend growth.
✅ Payout Ratio
The payout ratio is a key indicator of how much of its earnings a company returns to shareholders as dividends. ResMed has a payout ratio based on EPS of 22.16 % and 18.70 % based on free cash flow, suggesting a conservative approach, leaving room for reinvestment and future growth.
| Key figure | Ratio |
|---|---|
| EPS-based | 22.16 % |
| Free cash flow-based | 18.70 % |
The payout ratios indicate a healthy dividend policy, with earnings and free cash flow sufficiently covering the dividends paid out to shareholders.
💰 Cashflow & Capital Efficiency
Understanding a company’s cash flow is crucial in assessing its ability to sustain and grow its dividend payouts. ResMed’s financial ratios indicate efficient capital allocation, with a free cash flow to operating cash flow ratio of 94.87 % and competitive returns on invested capital.
| Year | 2025 | 2024 | 2023 |
|---|---|---|---|
| Free Cash Flow Yield | 4.39 % | 4.68 % | 1.74 % |
| Earnings Yield | 3.70 % | 3.71 % | 2.80 % |
| CAPEX to Operating Cash Flow | 5.13 % | 8.20 % | 19.33 % |
| Stock-based Compensation to Revenue | 1.78 % | 1.71 % | 1.68 % |
| Free Cash Flow / Operating Cash Flow Ratio | 94.87 % | 91.80 % | 80.67 % |
The cashflow metrics highlight ResMed's robust operational efficiency, providing confidence in its sustained ability to fund dividends and invest in growth opportunities.
🔍 Balance Sheet & Leverage Analysis
A strong balance sheet with sustainable leverage ratios is pivotal for a company’s financial health and ability to withstand market fluctuations. ResMed maintains solid liquidity positions, with significant coverage for its obligations, as evidenced by healthy debt ratios and interest coverage.
| Year | 2025 | 2024 | 2023 |
|---|---|---|---|
| Debt-to-Equity | 0.15 | 0.18 | 0.38 |
| Debt-to-Assets | 0.11 | 0.13 | 0.23 |
| Debt-to-Capital | 0.13 | 0.15 | 0.28 |
| Net Debt to EBITDA | -0.17 | 0.41 | 1.00 |
| Current Ratio | 3.44 | 2.59 | 3.12 |
| Quick Ratio | 2.53 | 1.69 | 1.81 |
| Financial Leverage | 1.37 | 1.41 | 1.63 |
ResMed's leverage analysis shows manageable debt levels and substantial liquidity, safeguarding its financial stability and mitigating risk exposure.
📊 Fundamental Strength & Profitability
Profitability and internal efficiency are critical in evaluating a company’s overall strength. ResMed’s metrics such as return on equity, assets, and profitability margins highlight its effective operational management and potential for future growth.
| Year | 2025 | 2024 | 2023 |
|---|---|---|---|
| Return on Equity | 23.47 % | 20.99 % | 21.73 % |
| Return on Assets | 17.14 % | 14.86 % | 13.29 % |
| Margins: Net | 27.22 % | 21.79 % | 21.25 % |
| EBIT Margin | 32.60 % | 27.97 % | 27.52 % |
| EBITDA Margin | 37.18 % | 32.73 % | 32.18 % |
| Gross Margin | 59.36 % | 56.67 % | 55.78 % |
| Research & Development to Revenue | 6.44 % | 6.56 % | 6.81 % |
ResMed consistently generates impressive returns on its assets and equity, validating its business efficiency and the quality of its earnings within the competitive healthcare landscape.
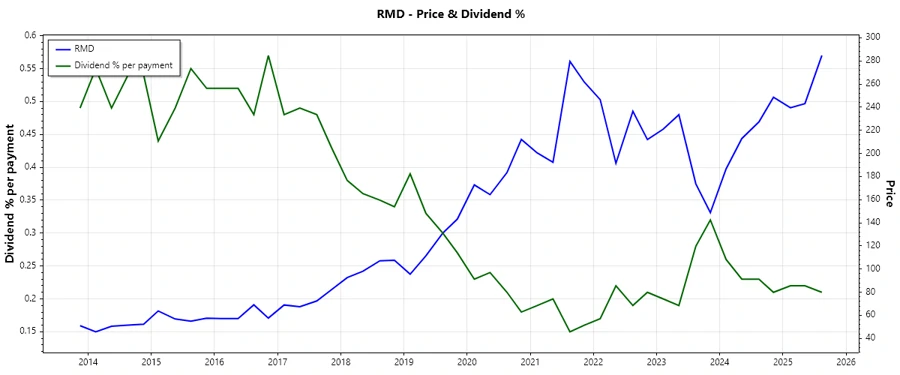
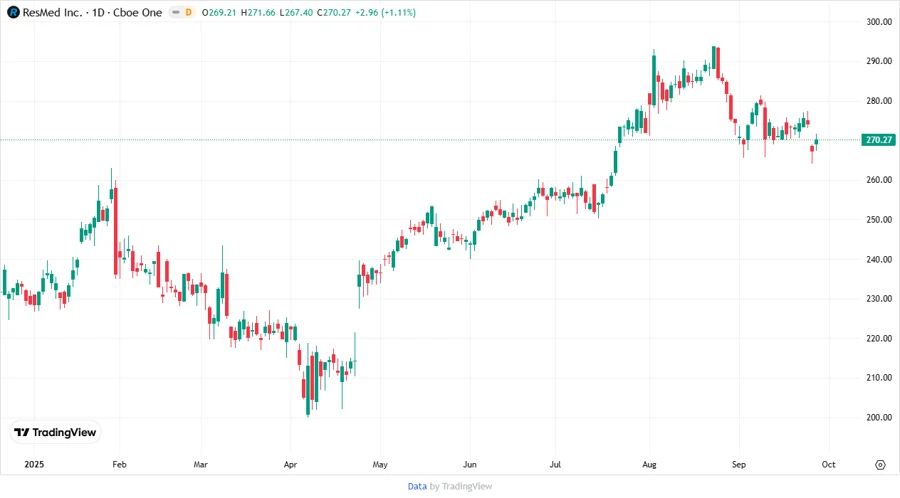
📈 Price Development
🔍 Dividend Scoring System
The Dividend Scoring System below evaluates ResMed's dividend-paying capabilities and financial health across various metrics.
| Category | Score (1-5) | Score Bar |
|---|---|---|
| Dividend yield | 2 | |
| Dividend Stability | 4 | |
| Dividend growth | 3 | |
| Payout ratio | 5 | |
| Financial stability | 4 | |
| Dividend continuity | 5 | |
| Cashflow Coverage | 4 | |
| Balance Sheet Quality | 4 |
Total score: 31/40
✅ Rating
ResMed Inc. displays a compelling financial and dividend profile, boasting strong balance sheet fundamentals and a disciplined dividend policy. Despite a lower dividend yield, the company’s growth potential and robust financial health make it an attractive long-term investment for dividend-oriented investors.
Smart Data Insight
Master the Perfect Entry & Exit for this Stock
Don't leave your profits to chance. Historically, this stock follows specific seasonal patterns that institutional traders use to maximize returns.
- ✅ Identify the "Golden Buying Window"
- ✅ Avoid high-risk correction cycles
- ✅ Backtested data from the last 20+ years