July 27, 2025 a 02:46 am


RMD: Dividend Analysis - ResMed Inc.
📊 ResMed Inc. is a leader in the healthcare sector, boasting a solid dividend history of 14 years. With a current dividend yield of 0.87%, the company has shown a steady dividend growth of 5.85% over five years. Despite a relatively low yield, the reliable growth and solid financial metrics present an attractive prospect for long-term dividend investors.
Overview
🗣️ ResMed Inc. operates in the healthcare sector, providing unique solutions and demonstrating resilience in dividend distributions. The following table summarizes key dividend metrics:
| Metric | Value |
|---|---|
| Sector | Healthcare |
| Dividend Yield | 0.87% |
| Current Dividend per Share | 1.92 USD |
| Dividend History | 14 years |
| Last Cut or Suspension | None |
Dividend History
📈 ResMed's consistent dividends over the years make it a reliable choice for income-focused investors. Maintaining a steady dividend is crucial as it reflects the company's profitability and management's commitment to returning value to shareholders.
| Year | Dividend per Share (USD) |
|---|---|
| 2025 | 1.06 |
| 2024 | 2.02 |
| 2023 | 1.84 |
| 2022 | 1.72 |
| 2021 | 1.62 |
Dividend Growth
📈 Over the past five years, ResMed Inc. has demonstrated a robust dividend growth rate, reflective of the company's financial health and its strategic approach to sustaining its dividend flow. The continuous dividend growth hints at potential future increases.
| Time | Growth |
|---|---|
| 3 years | 7.63% |
| 5 years | 5.85% |
The average dividend growth is 5.85% over 5 years. This shows moderate but steady dividend growth.
Payout Ratio
✅ Understanding payout ratios is vital for assessing the sustainability of dividend payouts. ResMed maintains prudent EPS-based and free cash flow-based payout ratios, ensuring that dividends are well covered.
| Key Figure | Ratio |
|---|---|
| EPS-based | 21.45% |
| Free cash flow-based | 18.00% |
The payout ratios indicate a conservative approach to dividend payments, suggesting that ResMed is committed to maintaining a sustainable payout and retaining capital for future growth.
Cashflow & Capital Efficiency
📊 Cash flow and capital efficiency indicators are critical for evaluating a company's financial flexibility. ResMed's positive free cash flow yield and efficient capital deployment underscore its ability to support ongoing dividends and business expansions.
| Year | 2024 | 2023 | 2022 |
|---|---|---|---|
| Free Cash Flow Yield | 4.68% | 1.74% | 0.64% |
| Earnings Yield | 3.71% | 2.80% | 2.55% |
| CAPEX to Operating Cash Flow | 8.20% | 19.33% | 44.44% |
| Stock-based Compensation to Revenue | 1.71% | 1.68% | 1.82% |
| Free Cash Flow / Operating Cash Flow Ratio | 91.80% | 80.67% | 55.56% |
ResMed's ability to maintain a strong free cash flow to operating cash flow ratio is indicative of efficient management and a solid base for long-term financial health.
Balance Sheet & Leverage Analysis
📉 Strong balance sheet metrics are essential for financial stability. ResMed's low debt ratios highlight its conservative leverage approach, ensuring resilience in various economic environments.
| Year | 2024 | 2023 | 2022 |
|---|---|---|---|
| Debt-to-Equity | 0.18 | 0.38 | 0.27 |
| Net Debt to EBITDA | -0.05 | 0.99 | 0.55 |
| Current Ratio | 3.41 | 3.12 | 2.80 |
| Quick Ratio | 1.69 | 1.81 | 1.72 |
ResMed's balance sheet strength, with low leverage and high liquidity ratios, suggests excellent financial flexibility and low bankruptcy risk.
Fundamental Strength & Profitability
📈 Profitability ratios are crucial for evaluating operational efficiency. ResMed shows robust returns on equity and assets, demonstrating effective resource utilization and a competitive edge in the healthcare sector.
| Year | 2024 | 2023 | 2022 |
|---|---|---|---|
| Return on Equity | 20.99% | 21.73% | 23.19% |
| Return on Assets | 14.86% | 13.29% | 15.30% |
| Net Profit Margin | 21.59% | 21.25% | 21.78% |
| Research & Development to Revenue | 6.56% | 6.81% | 7.09% |
The high returns and margins reflect ResMed's capacity to maintain profitability even with increased research expenditure, securing its innovative leadership in the industry.
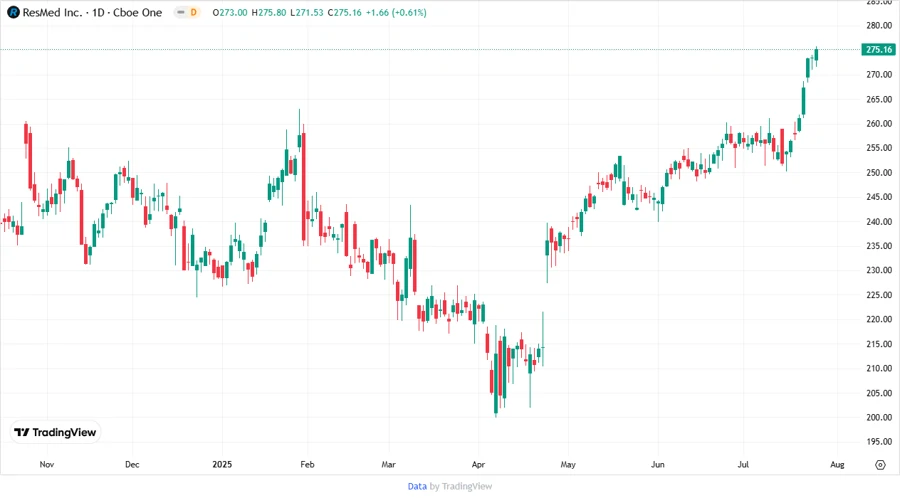
Price Development
Dividend Scoring System
| Criteria | Score | Score Bar |
|---|---|---|
| Dividend Yield | 3 | |
| Dividend Stability | 5 | |
| Dividend Growth | 4 | |
| Payout Ratio | 5 | |
| Financial Stability | 5 | |
| Dividend Continuity | 5 | |
| Cashflow Coverage | 4 | |
| Balance Sheet Quality | 5 |
Total Score: 36/40 🌟 Excellent
Rating
✅ ResMed Inc. presents a compelling case for dividend-focused investors, supported by its strong financial health, stable dividend payouts, and consistent growth trajectory. While the yield is modest, the reliable growth and sound business fundamentals point to a promising future. It is a hold for investors seeking steady, long-term returns.
Smart Data Insight
Master the Perfect Entry & Exit for this Stock
Don't leave your profits to chance. Historically, this stock follows specific seasonal patterns that institutional traders use to maximize returns.
- ✅ Identify the "Golden Buying Window"
- ✅ Avoid high-risk correction cycles
- ✅ Backtested data from the last 20+ years