December 19, 2025 a 03:31 am

RL: Dividend Analysis - Ralph Lauren Corporation
Ralph Lauren Corporation has demonstrated a resilient commitment to its shareholders through a consistent dividend history. With a dividend yield of approximately 0.96% and a stable payout ratio, the company shows a modest but reliable income stream for investors. The 5-year dividend growth signals moderate appreciation, indicating a potential for enhanced returns.
📊 Overview
The comprehensive overview of Ralph Lauren Corporation reveals a well-established dividend-paying entity with strategic initiatives in place to ensure long-term shareholder value.
| Parameter | Value |
|---|---|
| Sector | Consumer Discretionary |
| Dividend yield | 0.96% |
| Current dividend per share | 3.21 USD |
| Dividend history | 23 years |
| Last cut or suspension | 2020 |
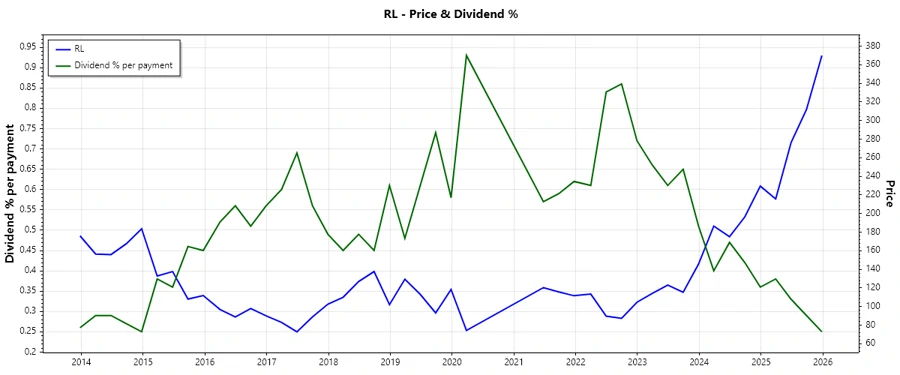
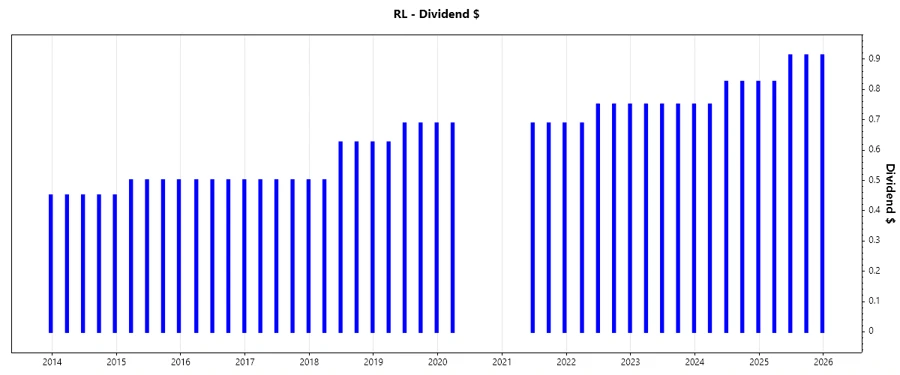
🗣️ Dividend History
The dividend history of Ralph Lauren is a testament to its capacity to deliver returns under varying market conditions, demonstrating resilience and consistent growth.
| Year | Dividend per Share (USD) |
|---|---|
| 2025 | 3.56 |
| 2024 | 3.23 |
| 2023 | 3.00 |
| 2022 | 2.94 |
| 2021 | 2.06 |
📈 Dividend Growth
The historical dividend growth rates are crucial indicators reflecting the company's ability to increase shareholder returns through time.
| Time | Growth |
|---|---|
| 3 years | 16.07% |
| 5 years | 3.71% |
The average dividend growth is 3.71% over 5 years. This shows moderate but steady dividend growth.
⚠️ Payout Ratio
Understanding the payout ratios is essential in assessing the sustainability of the company's dividend policy.
| Key Figure | Ratio |
|---|---|
| EPS-based | 23.50% |
| Free cash flow-based | 29.18% |
The payout ratios suggest a conservative approach with room for potential dividend increases, keeping payouts sustainable in both earnings and cash flow contexts.
✅ Cashflow & Capital Efficiency
An analysis of cash flows and capital efficiency emphasizes the company's ability to maintain liquidity whilst being efficient in capital deployment.
| Year | 2025 | 2024 | 2023 |
|---|---|---|---|
| Free Cash Flow Yield | 7.55% | 7.39% | 2.45% |
| Earnings Yield | 5.50% | 5.28% | 6.62% |
| CAPEX to Operating Cash Flow | 17.50% | 15.41% | 52.92% |
| Stock-based Compensation to Revenue | 1.52% | 1.50% | 1.17% |
| Free Cash Flow / Operating Cash Flow Ratio | 82.50% | 84.59% | 47.08% |
Ralph Lauren exhibits commendable cash flow management and robust capital efficiency, securing long-term sustainability and capital returns.
📊 Balance Sheet & Leverage Analysis
Key parameters reflecting the company's financial leverage and balance sheet robustness are pivotal in assessing risk and financial health.
| Year | 2025 | 2024 | 2023 |
|---|---|---|---|
| Debt-to-Equity | 1.03 | 1.09 | 1.19 |
| Debt-to-Assets | 0.38 | 0.41 | 0.42 |
| Debt-to-Capital | 0.51 | 0.52 | 0.54 |
| Net Debt to EBITDA | 0.61 | 0.97 | 1.42 |
| Current Ratio | 1.78 | 2.29 | 2.23 |
| Quick Ratio | 1.33 | 1.68 | 1.51 |
| Financial Leverage | 2.72 | 2.69 | 2.79 |
Solid financial ratios showcase Ralph Lauren's strong liquidity and manageable leverage, underpinning its capacity to weather market volatility.
📈 Fundamental Strength & Profitability
Indicators of profitability such as return metrics and profit margins validate Ralph Lauren's operational efficiency and market prowess.
| Year | 2025 | 2024 | 2023 |
|---|---|---|---|
| Return on Equity | 28.70% | 26.38% | 21.51% |
| Return on Assets | 10.54% | 9.79% | 7.70% |
| Net Margin | 10.49% | 9.75% | 8.11% |
| EBIT Margin | 14.05% | 12.36% | 11.36% |
| EBITDA Margin | 17.15% | 15.81% | 14.79% |
| Gross Margin | 68.55% | 66.83% | 64.65% |
| Research & Development to Revenue | 0.00% | 0.00% | 0.00% |
Impressive profitability metrics highlight the company's capability to generate substantial returns on equity and assets, bolstering overall economic performance.
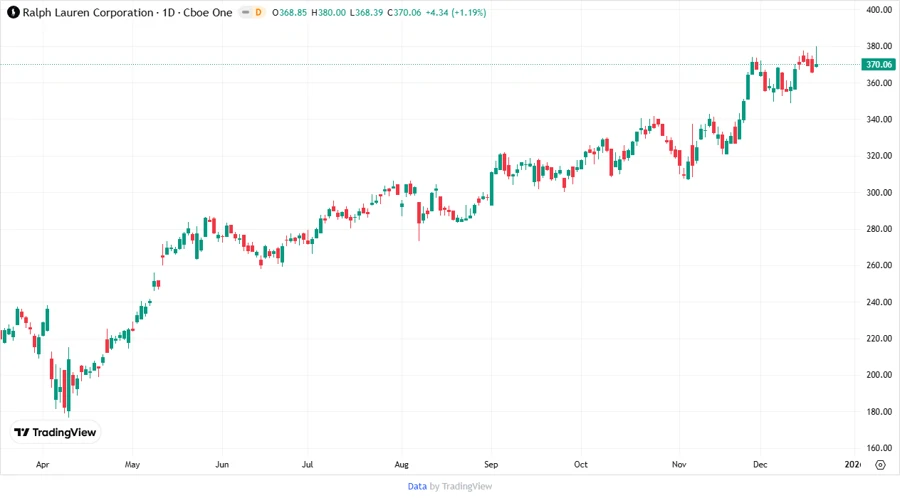
📉 Price Development
📊 Dividend Scoring System
| Category | Score | |
|---|---|---|
| Dividend yield | 3 | |
| Dividend Stability | 4 | |
| Dividend growth | 3 | |
| Payout ratio | 5 | |
| Financial stability | 4 | |
| Dividend continuity | 3 | |
| Cashflow Coverage | 4 | |
| Balance Sheet Quality | 4 |
Total Score: 30/40
🎯 Rating
Ralph Lauren Corporation holds a strong standing with moderate dividend yield, notable financial stability, and consistent dividend continuity. A recommendation for existing income-focused portfolios with room for modest growth potential.