September 23, 2025 a 03:31 am
RL: Dividend Analysis - Ralph Lauren Corporation
Ralph Lauren Corporation presents a unique mix of dividend yield and capital efficiency. 📈 The company's dividend history shows resilience and consistent payouts. Its growth in dividends, albeit moderate, signals dedication towards returning value to shareholders. Despite market fluctuations, the firm maintains a solid payout ratio, indicating potential for future stability in dividend payments.
📊 Overview
Ralph Lauren Corporation, operating in the renowned Consumer Discretionary sector, demonstrates admirable dividend performance.
| Metric | Value |
|---|---|
| Sector | Consumer Discretionary |
| Dividend yield | 1.13% |
| Current dividend per share | 3.21 USD |
| Dividend history | 23 years |
| Last cut or suspension | None |
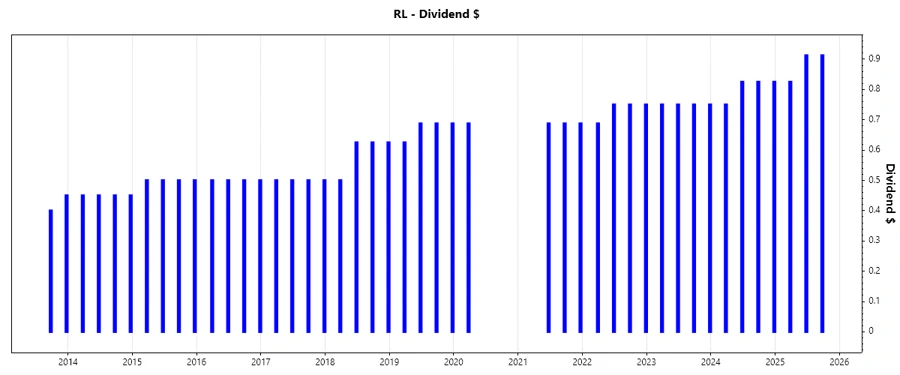
🗣️ Dividend History
Ralph Lauren's dividend history of 23 years underscores its commitment to rewarding investors. This long streak without significant cuts is indicative of strong cash flow management and confidence in its earnings stability.
| Year | Dividend per Share (USD) |
|---|---|
| 2025 | 2.65 |
| 2024 | 3.225 |
| 2023 | 3.00 |
| 2022 | 2.9375 |
| 2021 | 2.0625 |
📈 Dividend Growth
Dividend growth is an essential indicator of a company's ability to enhance shareholder value over time. Ralph Lauren exhibits moderate dividend growth over the past years, reflecting increasing investor returns while maintaining financial health.
| Time | Growth |
|---|---|
| 3 years | 16.07% |
| 5 years | 3.71% |
The average dividend growth is 3.71% over 5 years. This shows moderate but steady dividend growth.
✅ Payout Ratio
Payout ratios are crucial for assessing the sustainability of a company’s dividends. Ralph Lauren maintains an admirable balance between dividends and retained earnings.
| Key figure | Ratio |
|---|---|
| EPS-based | 24.66% |
| Free cash flow-based | 25.48% |
With payout ratios of 24.66% (EPS) and 25.48% (FCF), Ralph Lauren shows a conservative stance, suggesting capacity for sustaining dividends even in potential downturns.
📉 Cashflow & Capital Efficiency
A detailed analysis of cash flow and capital efficiency highlights Ralph Lauren's operational strength and investor-friendly financial management. The following table shows key metrics across different years.
| Metric | 2025 | 2024 | 2023 |
|---|---|---|---|
| Free Cash Flow Yield | 7.55% | 7.39% | 2.45% |
| Earnings Yield | 5.50% | 5.28% | 6.62% |
| CAPEX to Operating Cash Flow | 17.50% | 15.41% | 52.92% |
| Stock-based Compensation to Revenue | 1.52% | 1.50% | 1.17% |
| Free Cash Flow / Operating Cash Flow Ratio | 82.50% | 84.59% | 47.08% |
| Return on Invested Capital | 20.43% | 11.64% | 9.53% |
Ralph Lauren demonstrates robust cash flow stability with significant yields and reasonable capital deployment, which enhances return on investment and future dividend prospects.
⚠️ Balance Sheet & Leverage Analysis
Understanding the balance sheet composition and leveraging factors provides insight into financial resilience. Ralph Lauren displays a well-structured balance sheet conducive to sustaining its operations smoothly.
| Metric | 2025 | 2024 | 2023 |
|---|---|---|---|
| Debt-to-Equity | 1.03 | 1.09 | 1.19 |
| Debt-to-Assets | 37.86% | 40.52% | 42.45% |
| Debt-to-Capital | 50.76% | 52.19% | 54.25% |
| Net Debt to EBITDA | 0.61 | 0.95 | 1.69 |
| Current Ratio | 1.78 | 2.29 | 2.23 |
| Quick Ratio | 1.33 | 1.68 | 1.51 |
| Financial Leverage | 2.72 | 2.69 | 2.79 |
With stable financial leverage and a commendable current ratio, Ralph Lauren proves to have sound liquidity and adept debt management.
✅ Fundamental Strength & Profitability
Indicators of profitability and overall financial health paint a clear picture of Ralph Lauren's integration of operational efficiency and effective asset utilization.
| Metric | 2025 | 2024 | 2023 |
|---|---|---|---|
| Return on Equity | 28.70% | 26.38% | 21.51% |
| Return on Assets | 10.54% | 9.79% | 7.70% |
| Net Margin | 10.49% | 9.75% | 8.11% |
| EBIT Margin | 14.23% | 12.36% | 11.36% |
| Research & Development to Revenue | 0% | 0% | 0% |
As seen, Ralph Lauren showcases strong profitability, emphasizing its effective utilization of assets and equity to generate returns.
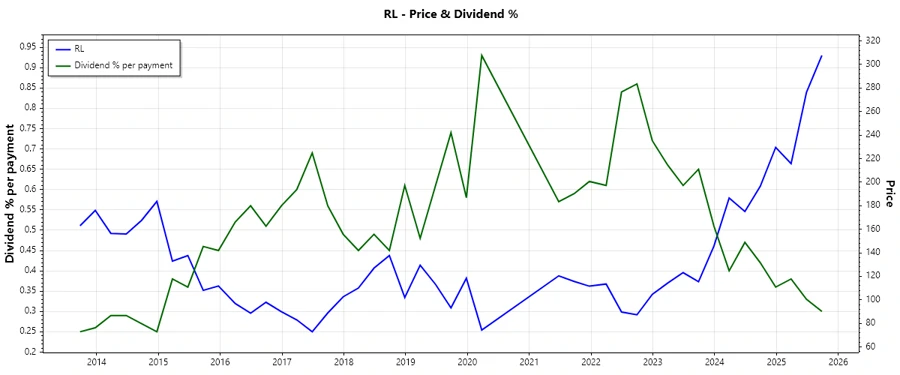
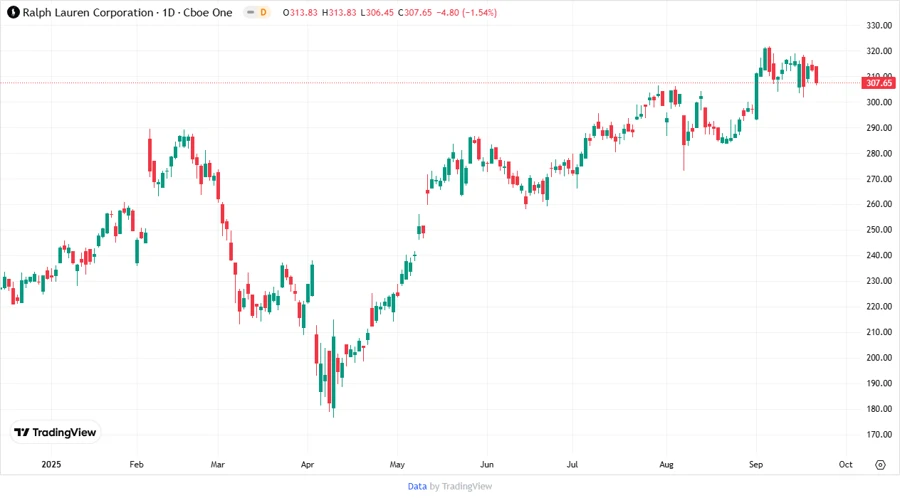
Price Development
📊 Dividend Scoring System
| Criterion | Score (/5) | Score Bar |
|---|---|---|
| Dividend yield | 4 | |
| Dividend Stability | 5 | |
| Dividend growth | 3 | |
| Payout ratio | 5 | |
| Financial stability | 4 | |
| Dividend continuity | 5 | |
| Cashflow Coverage | 4 | |
| Balance Sheet Quality | 4 |
Overall Score: 34/40
Rating
Based on a comprehensive analysis of Ralph Lauren Corporation's dividend profile and financial indicators, the company receives a strong recommendation for investors seeking stable dividend yields and solid financial underpinning. The firm's consistency in its cash flow, along with prudent financial management, suggests sustained dividend payments in the foreseeable future.
Smart Data Insight
Master the Perfect Entry & Exit for this Stock
Don't leave your profits to chance. Historically, this stock follows specific seasonal patterns that institutional traders use to maximize returns.
- ✅ Identify the "Golden Buying Window"
- ✅ Avoid high-risk correction cycles
- ✅ Backtested data from the last 20+ years