
June 16, 2026 a 04:03 am

RJF: Trend and Support & Resistance Analysis - Raymond James Financial, Inc.
Raymond James Financial, Inc. (RJF) has exhibited notable market trends marked by fluctuations influenced by its diverse financial services operations. The stock's recent movements demonstrate its potential resilience or challenges depending on macroeconomic conditions and sector-specific dynamics. Through this analysis, we will delve into trend patterns and identify key support and resistance zones that are critical for investors looking to establish positions in RJF.
Trend Analysis
| Date | Closing Price | Trend |
|---|---|---|
| 2026-06-15 | 154.71 | ▲ Upward |
| 2026-06-12 | 154.40 | ▲ Upward |
| 2026-06-11 | 150.42 | ▼ Downward |
| 2026-06-10 | 150.59 | ▼ Downward |
| 2026-06-09 | 151.37 | ⚖️ Sideways |
| 2026-06-08 | 150.19 | ▼ Downward |
| 2026-06-05 | 151.45 | ▲ Upward |
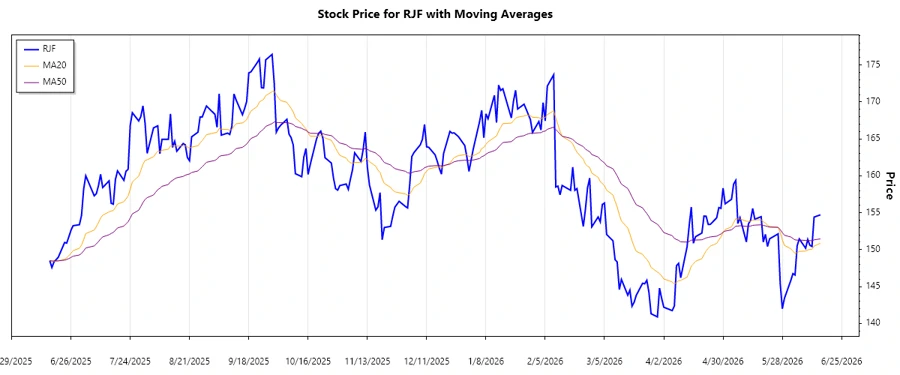
The recent trend exhibits a mix of upward and downward movements with signs of sideways activity, showcasing a volatile nature. The EMA20 has crossed above EMA50, indicating a general upward trend marker, suggesting potential bullishness pending further economic indicators.
Support- and Resistance
| Zone Type | From | To |
|---|---|---|
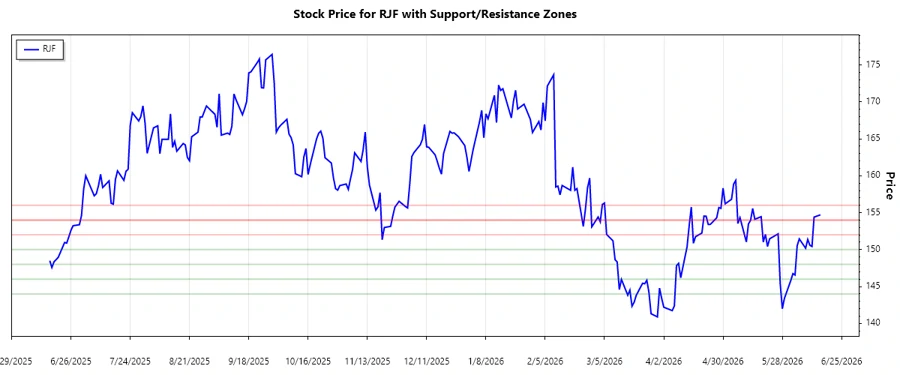
| Resistance | 154.00 | 156.00 ▲ |
| Resistance | 152.00 | 154.00 ▲ |
| Support | 148.00 | 150.00 ▼ |
| Support | 144.00 | 146.00 ▼ |
The current stock price is testing the lower boundary of the nearest resistance zone, suggesting potential difficulty in breaking higher. If the stock price fails to break resistance levels, a retest of support zones is probable, barring any significant market catalysts.
Conclusion
In conclusion, Raymond James Financial, Inc. is experiencing upward momentum with signs of resistance overhead. Analysts should be aware of volatile movements potentially influenced by macroeconomic trends and sector shifts. Investing decisions should consider current resistance zones and the strength of recent support levels, which will be critical in anticipating future price actions. While opportunities may arise, investors should remain cautious of risks associated with potential market shifts.
Smart Data Insight
Master the Perfect Entry & Exit for this Stock
Don't leave your profits to chance. Historically, this stock follows specific seasonal patterns that institutional traders use to maximize returns.
- ✅ Identify the "Golden Buying Window"
- ✅ Avoid high-risk correction cycles
- ✅ Backtested data from the last 20+ years