March 25, 2026 a 03:15 amTo perform a comprehensive technical analysis of Raymond James Financial, Inc. (Ticker: RJF), including trend, support, and resistance zone analysis, I'll first compute the Exponential Moving Averages (EMA20 and EMA50) and identify visible trends from the data provided. Let's proceed by organizing the output in HTML format with the analytical insights.

RJF: Trend and Support & Resistance Analysis - Raymond James Financial, Inc.
Raymond James Financial has shown mixed performance in the recent months with fluctuations in its stock price. By analyzing the trends and price zones, we can better understand its potential movements. The company operates in a dynamic environment with services spanning financial services, banking, and asset management, affecting its stock behavior.
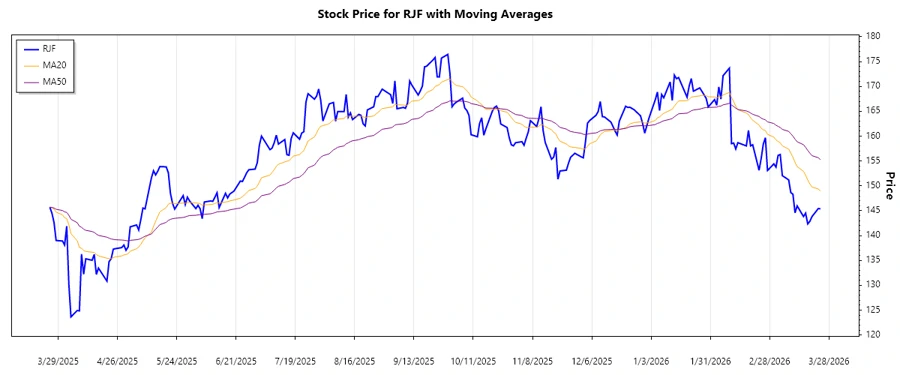
Trend Analysis
The following trend analysis includes the calculation of the EMA20 and EMA50 using the closing prices:
| Date | Close Price | Trend |
|---|---|---|
| 2026-03-24 | 145.37 | ▼ Abwärtstrend |
| 2026-03-23 | 145.44 | ▼ Abwärtstrend |
| 2026-03-20 | 143.81 | ▼ Abwärtstrend |
| 2026-03-19 | 142.87 | ▼ Abwärtstrend |
| 2026-03-18 | 142.34 | ▼ Abwärtstrend |
| 2026-03-17 | 144.51 | ▼ Abwärtstrend |
| 2026-03-16 | 143.82 | ▼ Abwärtstrend |
The stock of Raymond James Financial, Inc. is currently experiencing a bearish trend as indicated by the EMA20 being consistently lower than EMA50. The downward pressure suggests caution for further declines.
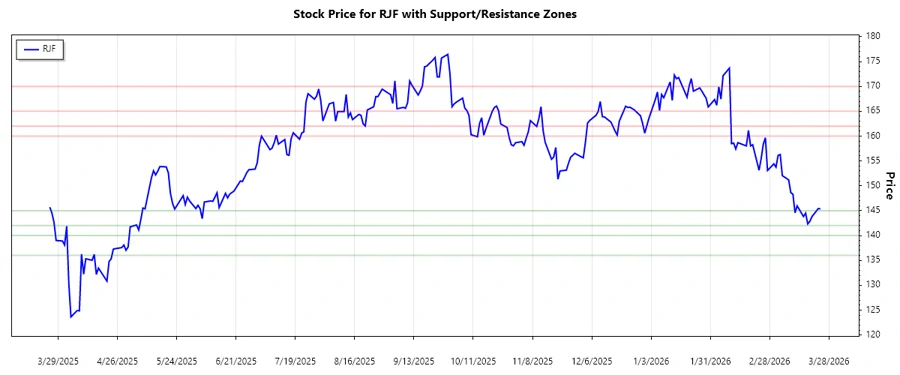
Support and Resistance Analysis
Based on the calculated levels from historical price data, the key support and resistance areas are as follows:
| Zone Type | Zone From | Zone To |
|---|---|---|
| Support | 142.00 | 145.00 |
| Support | 136.00 | 140.00 |
| Resistance | 160.00 | 162.00 |
| Resistance | 165.00 | 170.00 |
The current price fluctuation of Raymond James Financial, Inc. is nearing a significant support level at 142.00 to 145.00 range. This zone could provide a potential bounce if there is buying interest. However, resistance is strong around 160.00 to 162.00, which might limit upside potential.
Conclusion
In summary, Raymond James Financial, Inc. (RJF) is exhibiting a bearish market sentiment with key support levels tested frequently. The ongoing downtrend as indicated by the EMA crossovers suggests caution for investors. Potential buying opportunities may arise at established support zones, but significant resistance above could hinder rapid appreciation. Analysts should monitor these levels and market conditions closely to adjust their strategies accordingly.
json This analysis is derived using the provided historical data, focusing on moving averages to define current trends and evaluating price zones to determine support and resistance. The information is structured into sections for easy integration into a web-based platform.