February 09, 2026 a 08:15 am
RJF: Trend and Support & Resistance Analysis - Raymond James Financial, Inc.
Raymond James Financial, Inc., a key player in diversified financial services, has shown a complex pattern of price movements over the past months. The stock has faced volatility while navigating through economic and industry challenges. Recent analysis suggests a potential for stability with emerging trends and support levels offering some buffering against downward pressures. This analysis provides an overview of technical indicators and price zones essential for strategic positioning.
Trend Analysis
| Date | Close Price | Trend |
|---|---|---|
| 2026-02-06 | 172.14 | ▲ |
| 2026-02-05 | 167.44 | ▼ |
| 2026-02-04 | 169.89 | ▲ |
| 2026-02-03 | 166.20 | ▼ |
| 2026-02-02 | 167.34 | ⚖️ |
| 2026-01-30 | 165.86 | ▼ |
| 2026-01-29 | 167.61 | ▲ |
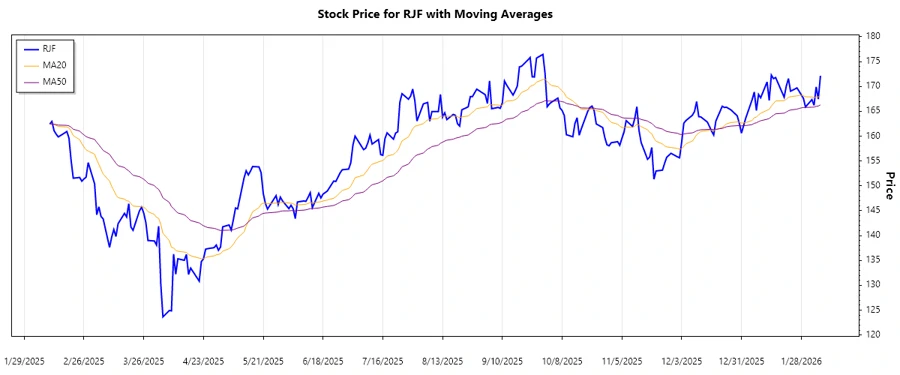
The analysis of EMA20 and EMA50 indicates a complex price pattern with recent movements depicting a slight upward trend as EMA20 surpasses EMA50 on some days. This precarious balance suggests cautious optimism.
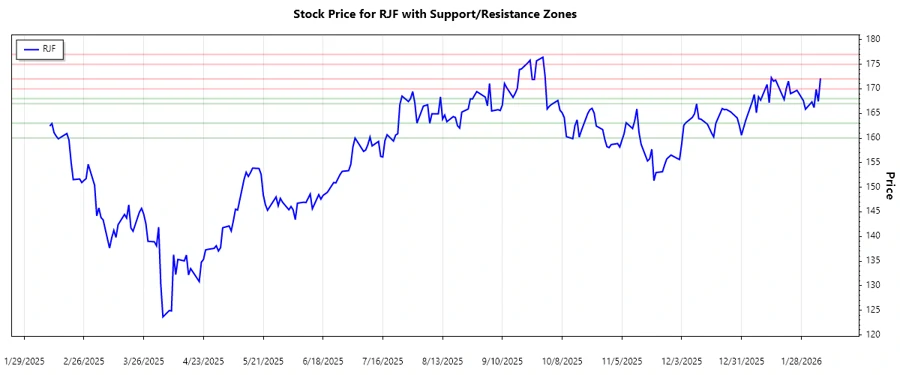
Support- and Resistance
| Zone Type | Zone Range |
|---|---|
| Support 1 | $160.00 - $163.00 |
| Support 2 | $167.00 - $168.00 |
| Resistance 1 | $170.00 - $172.00 |
| Resistance 2 | $175.00 - $177.00 |
The current price is navigating near the support levels, offering potential rebounds, while resistance barriers are identified above the current trading range.
Conclusion
Raymond James Financial, Inc. is positioned at a crucial juncture with support and resistance levels framing its current price territory. Analysts may find opportunities in the emerging upward trends after a recent period of price stabilization. However, vigilance remains essential due to market dynamics and external economic factors influencing the financial services sector, suggesting a balanced risk/reward scenario for stakeholders.