September 09, 2025 a 01:15 pm

RJF: Trend and Support & Resistance Analysis - Raymond James Financial, Inc.
Raymond James Financial, Inc. showcases a robust performance in financial services, impacting key markets across the US, Canada, and Europe. The recent data reflects dynamic price movements, requiring technical analysis to discern underlying trends. Understanding these patterns can inform strategic investments and optimize financial outcomes.
Trend Analysis
| Date | Closing Price | Trend |
|---|---|---|
| 2025-09-08 | $165.77 | ⚖️ |
| 2025-09-05 | $165.50 | ⚖️ |
| 2025-09-04 | $171.09 | ⚖️ |
| 2025-09-03 | $166.56 | ⚖️ |
| 2025-09-02 | $168.32 | ⚖️ |
| 2025-08-29 | $169.44 | ⚖️ |
| 2025-08-28 | $168.71 | ⚖️ |
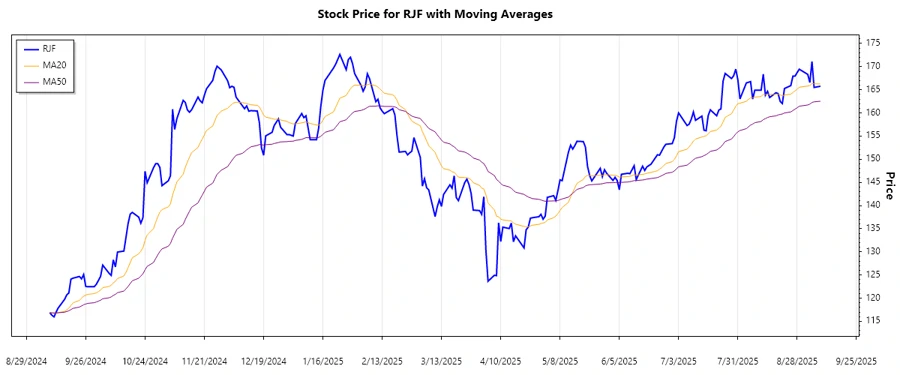
The EMA analysis indicates a largely neutral trend, suggesting a potential transition phase. This neutral positioning might point to awaiting news or a possible reversal pattern.
Support and Resistance
| Zone Type | From | To |
|---|---|---|
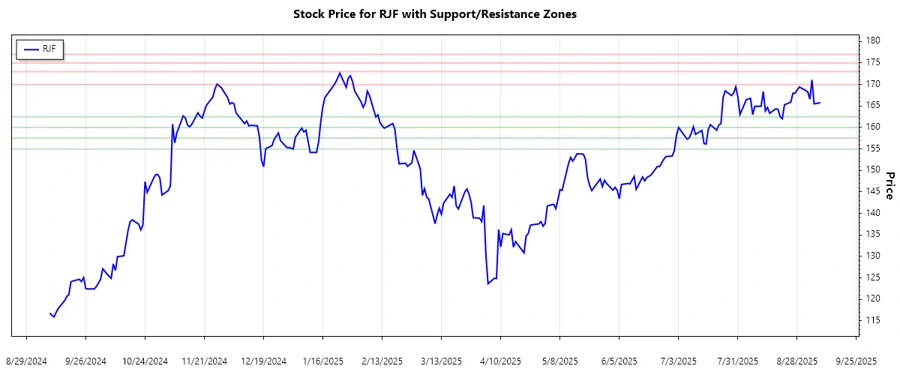
| Support Zone 1 | $160.00 | $162.50 |
| Support Zone 2 | $155.00 | $157.50 |
| Resistance Zone 1 | $170.00 | $173.00 |
| Resistance Zone 2 | $175.00 | $177.00 |
Currently, the stock is trading near a support zone, indicating potential buying opportunities if it maintains strength. Breaking through the existing resistance zones could signify further bullish momentum.
Conclusion
Raymond James Financial, Inc. exhibits a momentary pause in movement, reflected in the current sideway trend. The stock remains in close proximity to a support zone, indicating potential stability. Investors should monitor for any breakout above current resistance, signifying a bullish shift. Suitability for investment hinges on fundamental performance alongside this technical setup. Volatility in external markets could influence future price actions, necessitating ongoing evaluation. Analysts should stay vigilant for any alteration in technical indicators that might shift the current neutral bias.
Smart Data Insight
Master the Perfect Entry & Exit for this Stock
Don't leave your profits to chance. Historically, this stock follows specific seasonal patterns that institutional traders use to maximize returns.
- ✅ Identify the "Golden Buying Window"
- ✅ Avoid high-risk correction cycles
- ✅ Backtested data from the last 20+ years