June 17, 2025 a 09:03 am

RJF: Trend and Support & Resistance Analysis - Raymond James Financial, Inc.
The stock of Raymond James Financial, Inc. demonstrates a mixed trend pattern over recent months. While it has shown resilience with some upward spikes, recent data suggest a downturn phase. Investors should pay close attention to current market signals and support/resistance levels to strategize effectively.
Trend Analysis
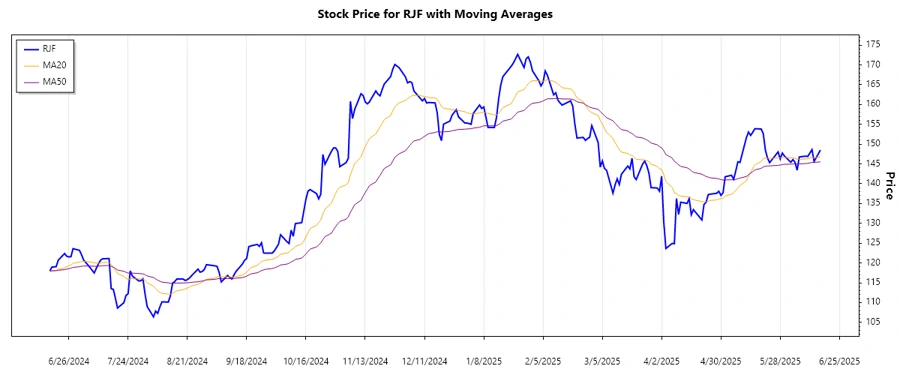
After analyzing recent daily closing prices, we have evaluated EMA values for insight into the stock's trend. The calculation of EMA20 and EMA50 suggests:
| Date | Close Price | Trend |
|---|---|---|
| 2025-06-16 | $148.50 | ▼ |
| 2025-06-13 | $145.62 | ▼ |
| 2025-06-12 | $148.61 | ▼ |
| 2025-06-11 | $147.73 | ▼ |
| 2025-06-10 | $146.88 | ▼ |
| 2025-06-09 | $146.96 | ▼ |
| 2025-06-06 | $146.75 | ▼ |
Currently, the stock displays a downward trend with EMA20 below EMA50. A deeper analysis is required to determine potential trend reversals or confirmation of the downward trend.
Support- and Resistance
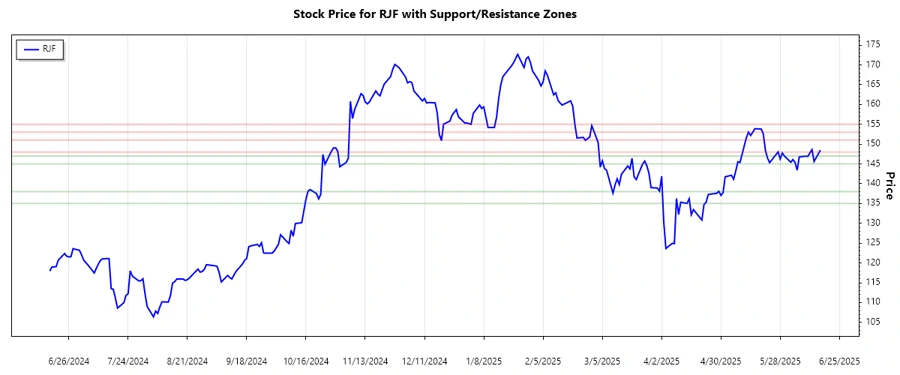
Key zones of support and resistance have been identified using historical price data:
| Zone Type | Price Range |
|---|---|
| Support 1 | ▲ $135.0 - $138.0 |
| Support 2 | ▲ $145.0 - $147.0 |
| Resistance 1 | ▼ $148.0 - $151.0 |
| Resistance 2 | ▼ $153.0 - $155.0 |
At present, the stock is trading within the second support zone, with a possibility of testing lower levels if the downward pressure persists.
Observation of price movement relative to these key zones can provide insights into potential reversals or continuations.
Conclusion
Raymond James Financial's current price activity indicates a cautionary stance, primarily influenced by a sustained downward trend. Traders may find interest around established support zones for potential rebounds. However, breaking below support levels could enforce further downside. This period calls for careful monitoring of market indicators and global financial sentiments, impacting the stock's trajectory. Risks remain, yet prudent entry points may unveil opportunities upon trend reversals.
Smart Data Insight
Master the Perfect Entry & Exit for this Stock
Don't leave your profits to chance. Historically, this stock follows specific seasonal patterns that institutional traders use to maximize returns.
- ✅ Identify the "Golden Buying Window"
- ✅ Avoid high-risk correction cycles
- ✅ Backtested data from the last 20+ years