May 06, 2026 a 08:00 am
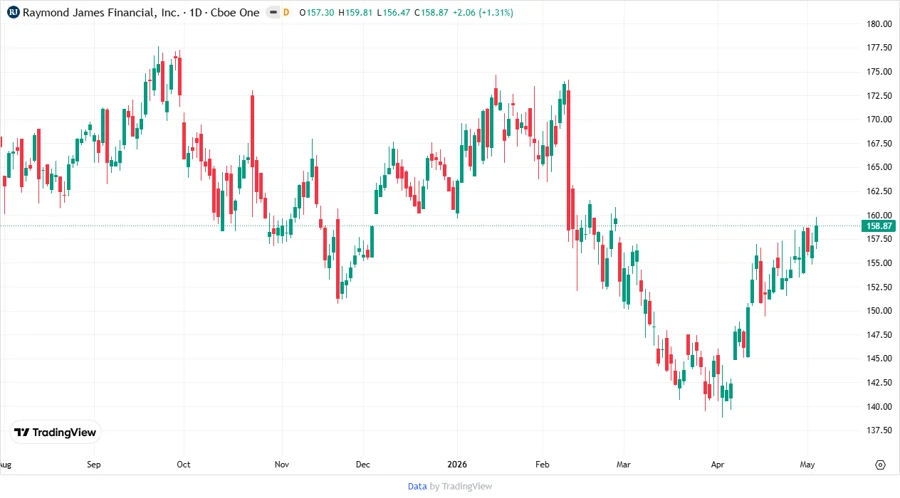
RJF: Fundamental Ratio Analysis - Raymond James Financial, Inc.
Raymond James Financial, Inc. offers a diversified portfolio in financial services across several regions. Present in the United States, Canada, and Europe, the company provides comprehensive financial offerings, from private client services to banking and asset management. Vigilant on the market trends, RJF stands as a sturdy option in the financial sector.
Fundamental Rating
Raymond James Financial, Inc. shows promising fundamental scores, with strength in assets management but challenges in equity returns.
| Category | Score | Visualization |
|---|---|---|
| Discounted Cash Flow | 3 | |
| Return on Equity | 1 | |
| Return on Assets | 5 | |
| Debt to Equity | 1 | |
| Price to Earnings | 2 | |
| Price to Book | 1 |
Historical Rating
Comparative analysis shows consistent performance with minor variations over time.
| Date | Overall Score | DCF | ROE | ROA | D/E | P/E | P/B |
|---|---|---|---|---|---|---|---|
| 2026-05-05 | 2 | 3 | 1 | 5 | 1 | 2 | 1 |
| Latest | 2 | 3 | 1 | 5 | 1 | 2 | 1 |
Analyst Price Targets
Analysts foresee steady growth potential with conservative price targets.
| High | Low | Median | Consensus |
|---|---|---|---|
| 172 | 166 | 169 | 169 |
Analyst Sentiment
The sentiment suggests a predominant leaning towards holding the stock, indicating stability.
| Recommendation | Count | Visualization |
|---|---|---|
| Strong Buy | 1 | |
| Buy | 9 | |
| Hold | 14 | |
| Sell | 0 | |
| Strong Sell | 0 |
Conclusion
Raymond James Financial, Inc. stands robust with a multi-faceted approach to financial services in key global markets. While it shows areas of low scoring in equity returns, its asset management strength and consistent performance offer an appealing investment opportunity. The stock's analyst sentiment generally favors holding, supporting its relatively stable outlook. Potential investors should consider both the strengths and the minor weaknesses when evaluating RJF as a part of their portfolio. Overall, RJF provides a balanced investment with moderate risk and competitive growth prospects.
Smart Data Insight
Master the Perfect Entry & Exit for this Stock
Don't leave your profits to chance. Historically, this stock follows specific seasonal patterns that institutional traders use to maximize returns.
- ✅ Identify the "Golden Buying Window"
- ✅ Avoid high-risk correction cycles
- ✅ Backtested data from the last 20+ years