
July 18, 2026 a 07:46 am
📊 RJF: Dividend Analysis - Raymond James Financial, Inc.
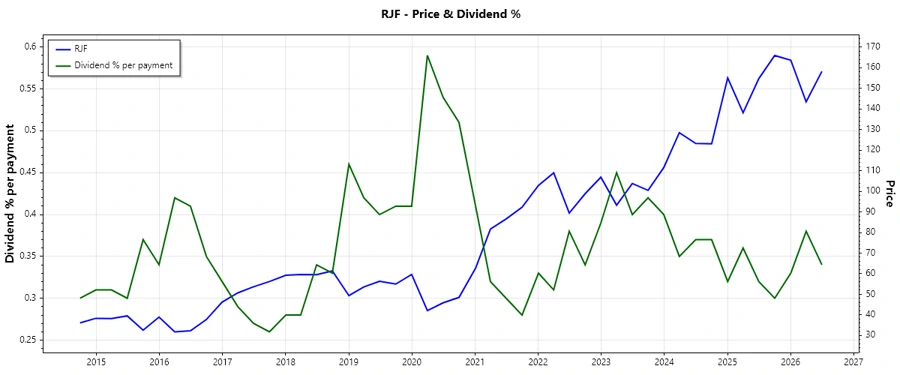
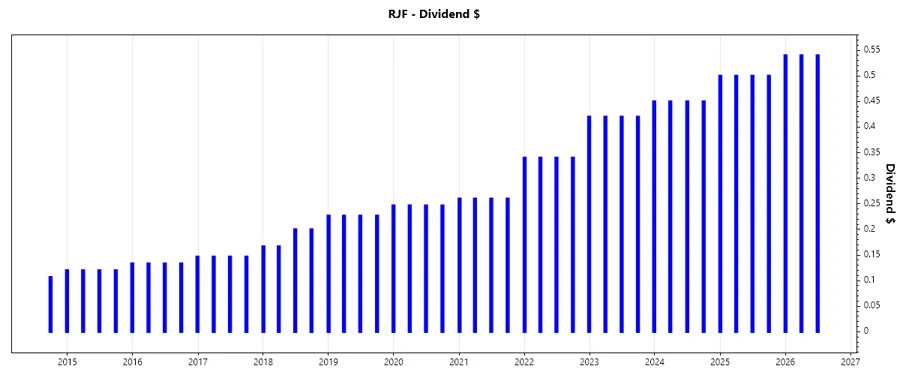
Raymond James Financial, Inc. has consistently demonstrated a commitment to its dividend payouts, reflected in its 42-year history of uninterrupted dividend distributions. With a current dividend yield of approximately 1.34%, the company maintains a conservative payout strategy, ensuring stable returns for long-term investors. Despite a modest yield, the firm's robust financial health and disciplined capital management augment its appeal to income-focused investors.
🗣️ Overview
The financial sector is a fertile ground for dividend growth, and Raymond James Financial, Inc. exemplifies this with its sustainable yield. Here's a look at some key metrics:
| Metric | Data |
|---|---|
| Sector | Financial |
| Dividend yield | 1.34% |
| Current dividend per share | 2.06 USD |
| Dividend history | 42 years |
| Last cut or suspension | None |
📈 Dividend History
A long-standing history of dividend payments signifies reliability and can foster investor confidence. It reflects the firm's ability to generate and maintain cash flows over various economic cycles.
| Year | Dividend Per Share (USD) |
|---|---|
| 2026 | 1.62 |
| 2025 | 2.00 |
| 2024 | 1.35 |
| 2023 | 1.71 |
| 2022 | 1.78 |
📉 Dividend Growth
Growth in dividends is often a harbinger of financial health and signals the company's confidence in its liquidity and future cash flows. Raymond James Financial has recorded the following dividend growth rates:
| Time | Growth |
|---|---|
| 3 years | 3.96% |
| 5 years | 21.99% |
The average dividend growth is 21.99% over 5 years. This shows moderate but steady dividend growth.
✅ Payout Ratio
The payout ratio is a key indicator of the sustainability of a company's dividend distributions. It compares the dividends paid to the company's earnings, providing insights into how comfortably the dividends are covered.
| Key figure | Ratio |
|---|---|
| EPS-based | 18.81% |
| Free cash flow-based | 16.83% |
An EPS payout ratio of 18.81% and a free cash flow payout ratio of 16.83% suggest that Raymond James Financial has ample room to maintain or even increase its dividend payouts.
Cashflow & Capital Efficiency
Cash flow stability and capital efficiency are crucial for maintaining operational flexibility and funding growth initiatives while meeting dividend commitments.
| Year | 2025 | 2024 | 2023 |
|---|---|---|---|
| Free Cash Flow Yield | 6.44% | 7.69% | -17.33% |
| Earnings Yield | 6.12% | 8.15% | 8.18% |
| CAPEX to Operating Cash Flow | 7.72% | 9.51% | -4.92% |
| Stock-based Compensation to Revenue | 1.60% | 1.72% | 1.85% |
| Free Cash Flow / Operating Cash Flow Ratio | 92.28% | 90.49% | 104.92% |
The data suggests that the company's cash flow generation and capital deployment are in alignment with sustaining and potentially elevating the dividend profile. Weakness in 2023's free cash flow yield calls for some caution.
Balance Sheet & Leverage Analysis
The balance sheet's strength often correlates with resilience during economic downturns, by enabling the servicing of debts and securing shareholder value through consistent dividends.
| Year | 2025 | 2024 | 2023 |
|---|---|---|---|
| Debt-to-Equity | 36.35% | 34.50% | 34.03% |
| Debt-to-Assets | 5.15% | 4.85% | 4.44% |
| Debt-to-Capital | 26.66% | 25.65% | 25.39% |
| Net Debt to EBITDA | -1.44 | -2.47 | -2.39 |
| Current Ratio | 0.32 | 0.38 | 0.38 |
| Quick Ratio | 0.32 | 0.38 | 0.38 |
| Financial Leverage | 7.06 | 7.11 | 7.67 |
Raymond James Financial demonstrates a well-managed leverage structure which hints at potentially lower financial risk, aligning with its ongoing commitment to dividend payments.
Fundamental Strength & Profitability
High profitability and robust operational margins denote efficiency and act as a buffer against downturns, simultaneously allowing for reinvestment in core assets and dividend payouts.
| Year | 2025 | 2024 | 2023 |
|---|---|---|---|
| Return on Equity | 17.08% | 17.72% | 17.03% |
| Return on Assets | 2.42% | 2.49% | 2.22% |
| Margins: Net | 13.42% | 14.03% | 13.54% |
| Margins: EBIT | 28.66% | 17.93% | 17.76% |
| Margins: EBITDA | 29.89% | 19.14% | 19.04% |
| Margins: Gross | 88.16% | 85.44% | 88.28% |
| Research & Development to Revenue | 0% | 0% | 0% |
With consistent returns on equity and assets, along with impressive margins, the company is strategically positioned to sustain its dividend policy efficiently.
Price Development
Dividend Scoring System
| Criterion | Score | |
|---|---|---|
| Dividend yield | 3 | |
| Dividend Stability | 5 | |
| Dividend growth | 4 | |
| Payout ratio | 5 | |
| Financial stability | 4 | |
| Dividend continuity | 5 | |
| Cashflow Coverage | 3 | |
| Balance Sheet Quality | 5 |
Total Score: 34/40
Rating
In conclusion, Raymond James Financial, Inc. maintains a formidable dividend profile characterized by a long history of stable and growing payouts. Its prudent payout ratios, impressive balance sheet strength, and steady cash flow generation provide a compelling proposition for dividend-focused investors. The company earns a high total score of 34/40, indicating a strong recommendation for those seeking stable income opportunities.
Smart Data Insight
Master the Perfect Entry & Exit for this Stock
Don't leave your profits to chance. Historically, this stock follows specific seasonal patterns that institutional traders use to maximize returns.
- ✅ Identify the "Golden Buying Window"
- ✅ Avoid high-risk correction cycles
- ✅ Backtested data from the last 20+ years