January 05, 2026 a 12:46 pm


RJF: Dividend Analysis - Raymond James Financial, Inc.
Raymond James Financial, Inc. boasts a robust dividend track record with a history of 42 consecutive years of dividends, demonstrating its commitment to returning value to shareholders. Despite a relatively modest dividend yield of 1.25%, the firm's impressive dividend growth over the past five years at 22% indicates a resilient upward trend. The strategic allocation of financial resources, alongside efficient capital management, suggests sustainability in future dividend payments, making RJF an attractive consideration for income-focused investors.
📊 Overview
Raymond James Financial operates within the Financial Services industry, showcasing a commendable commitment to dividend reliability. Below is an overview of its dividend-related key performance indicators:
| Factor | Value |
|---|---|
| Sector | Financial Services |
| Dividend Yield | 1.25 % |
| Current Dividend Per Share | 1.95 USD |
| Dividend History | 42 years |
| Last Cut or Suspension | None |
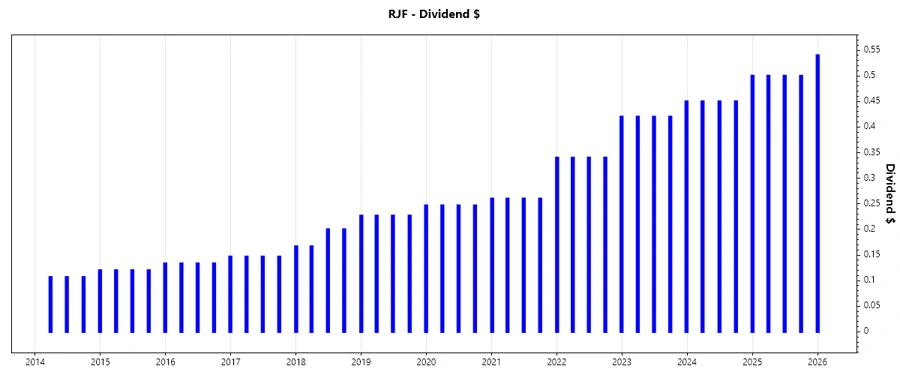
🗣️ Dividend History
An extensive dividend history signals financial resilience and a reliable income for investors. Below is a glimpse at Raymond James Financial's dividend per share over the last five years, complemented by a visual depiction of its trajectory:
| Year | Dividend Per Share (USD) |
|---|---|
| 2026 | 0.54 |
| 2025 | 2.00 |
| 2024 | 1.35 |
| 2023 | 1.71 |
| 2022 | 1.78 |
📈 Dividend Growth
Examining dividend growth gives insight into a company's capacity to enhance shareholder returns consistently. RJF has demonstrated a significant increase in dividend payouts over various time horizons, as shown below:
| Time | Growth |
|---|---|
| 3 years | 3.96 % |
| 5 years | 21.99 % |
The average dividend growth is 21.99 % over 5 years. This shows moderate but steady dividend growth.
✅ Payout Ratio
The payout ratio provides insight into the proportion of earnings and free cash flow a company is distributing as dividends. This is crucial to assess the durability and potential for future dividend growth:
| Key figure | Ratio |
|---|---|
| EPS-based | 18.18 % |
| Free Cash Flow-based | 26.02 % |
Both the EPS and FCF payout ratios are conservative at 18.18 % and 26.02 %, respectively, suggesting a strong capacity for future dividend increases while maintaining sufficient capital for operations and growth.
🌟 Cashflow & Capital Efficiency
Cash flow stability and judicious capital usage are indicative of a company's ability to invest in growth and return capital to shareholders through means such as dividends and buybacks:
| Year | 2023 | 2024 | 2025 |
|---|---|---|---|
| Free Cash Flow Yield | -17.33 % | 7.69 % | 6.44 % |
| Earnings Yield | 8.18 % | 8.15 % | 6.12 % |
| CAPEX to Operating Cash Flow | -4.92 % | 9.51 % | 7.72 % |
| Stock-based Comp. to Revenue | 1.85 % | 1.72 % | 0 % |
| Free Cash Flow/Operating Cash Flow | 104.92 % | 90.49 % | 92.28 % |
The data suggest a strong capability in generating cash flows with stable capital efficiency, reflected in solid yields and operating ratios.
🏦 Balance Sheet & Leverage Analysis
A robust balance sheet with controlled leverage ratios is crucial for long-term financial health and stability, particularly for sustaining dividend payments:
| Year | 2023 | 2024 | 2025 |
|---|---|---|---|
| Debt-to-Equity | 34.03 % | 34.50 % | 0 % |
| Debt-to-Assets | 4.44 % | 4.85 % | 0 % |
| Debt-to-Capital | 25.39 % | 25.65 % | 0 % |
| Net Debt to EBITDA | -2.39 | -2.47 | -2.50 |
| Current Ratio | 0.38 | 0.38 | 0 % |
| Quick Ratio | 0.38 | 0.38 | 0 % |
| Financial Leverage | 7.67 | 7.11 | 7.06 |
The leverage ratios indicate a prudent capital structure with an emphasis on minimizing debt risk, which bodes well for the continuity of dividends and overall financial health.
📊 Fundamental Strength & Profitability
Strong fundamentals and profitability metrics underpin the ability to sustain and increase dividends while ensuring competitive business operations and shareholder value:
| Year | 2023 | 2024 | 2025 |
|---|---|---|---|
| Return on Equity | 17.03 % | 17.72 % | 17.08 % |
| Return on Assets | 2.22 % | 2.49 % | 2.42 % |
| Margins: Net | 13.54 % | 14.03 % | 13.42 % |
| Margins: EBIT | 17.76 % | 18.03 % | 28.66 % |
| Margins: EBITDA | 19.04 % | 19.14 % | 28.66 % |
| Margins: Gross | 88.28 % | 85.44 % | 98.60 % |
| R&D to Revenue | 0 % | 0 % | 0 % |
The firm consistently maintains strong equity returns and profit margins, affirming its operational efficiency and capability to enhance shareholder dividends.
📈 Price Development
🧮 Dividend Scoring System
Below is the tailored dividend scoring system for Raymond James Financial, evaluating multiple factors to derive at an overall dividend quality score:
| Category | Score | |
|---|---|---|
| Dividend Yield | 3 | |
| Dividend Stability | 5 | |
| Dividend Growth | 4 | |
| Payout Ratio | 4 | |
| Financial Stability | 5 | |
| Dividend Continuity | 5 | |
| Cashflow Coverage | 3 | |
| Balance Sheet Quality | 4 |
Overall Score: 33/40
🎯 Rating
Raymond James Financial, Inc. showcases commendable financial and dividend attributes, with a high level of dividend continuity and stability. While the dividend yield is modest, the critical evaluation of financial stability, robust growth, and proficient management indicates a promising trajectory. This makes RJF a solid inclusion for investors emphasizing income in addition to potential capital appreciation.