October 21, 2025 a 12:46 pm

RJF: Dividend Analysis - Raymond James Financial, Inc.
Raymond James Financial, Inc. demonstrates strong dividend attributes with a stable history of payouts over 41 years, despite a recent dividend cut in 2024. Balancing a modest dividend yield of 1.21% with consistent growth, it emerges as a reliable choice for dividend-focused investors.
📊 Overview
| Attribute | Value |
|---|---|
| Sector | Finance |
| Dividend yield | 1.21% |
| Current dividend per share | 1.85 USD |
| Dividend history | 41 years |
| Last cut or suspension | 2024 |
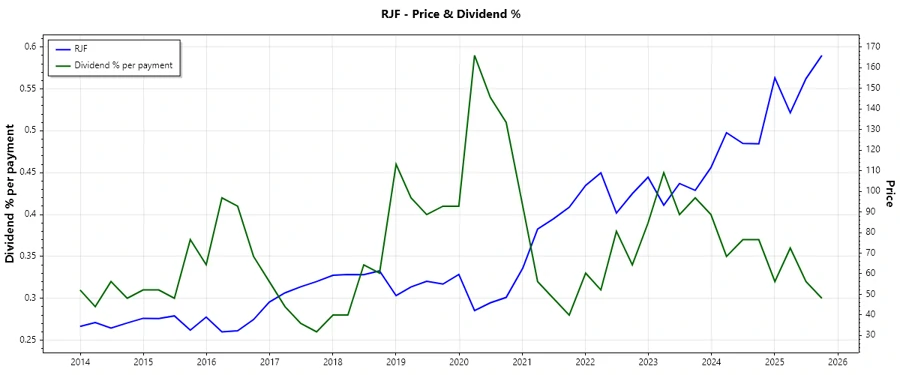
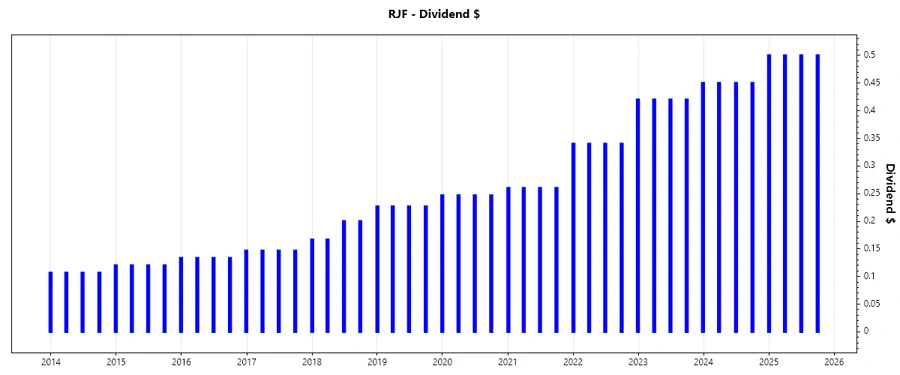
📈 Dividend History
The company's dividend history showcases its reliability in delivering shareholder value through regular payouts. Historical data provides insight into its long-term commitment and resilience.
| Year | Dividend per Share (USD) |
|---|---|
| 2025 | 2.00 |
| 2024 | 1.35 |
| 2023 | 1.71 |
| 2022 | 1.78 |
| 2021 | 1.04 |
📈 Dividend Growth
Dividend growth serves as a key indicator of management's confidence in the company's future earnings. Raymond James Financial has demonstrated a moderate but consistent growth pattern.
| Time | Growth |
|---|---|
| 3 years | 9.09% |
| 5 years | 3.20% |
The average dividend growth is 3.20% over 5 years. This shows moderate but steady dividend growth.
📈 Payout Ratio
The payout ratio provides insight into how effectively earnings support the dividend payouts. Lower ratios often imply safer dividends.
| Key Figure | Ratio |
|---|---|
| EPS-based | 17.44% |
| Free Cash Flow-based | 18.87% |
The payout ratios of 17.44% (EPS) and 18.87% (FCF) suggest a conservative approach, allowing room for future dividend growth.
Cashflow & Capital Efficiency
Evaluating cash flow metrics is vital for understanding the company's capability to sustain its operations and invest in growth. They are also indicative of how well the company is achieving returns on invested capital.
| Year | 2024 | 2023 | 2022 |
|---|---|---|---|
| Free Cash Flow Yield | 7.69% | -17.33% | -0.09% |
| Earnings Yield | 8.15% | 8.18% | 7.27% |
| CAPEX to Operating Cash Flow | 9.03% | -4.92% | 126.39% |
| Stock-based Compensation to Revenue | 1.72% | 1.85% | 1.72% |
| Free Cash Flow / Operating Cash Flow Ratio | 90.49% | 104.92% | -26.39% |
The financial data reflects a company transitioning through cash flow challenges but with the potential for capital efficiency improvements.
Balance Sheet & Leverage Analysis
Understanding the balance sheet ratios is crucial to assess the company's ability to manage its debts and maintain financial stability.
| Year | 2024 | 2023 | 2022 |
|---|---|---|---|
| Debt-to-Equity | 34.50% | 34.03% | 40.12% |
| Debt-to-Assets | 4.85% | 4.44% | 4.69% |
| Debt-to-Capital | 25.65% | 25.39% | 28.64% |
| Net Debt to EBITDA | -2.47 | -2.39 | -1.04 |
| Current Ratio | 0.33 | 0.38 | 0.32 |
| Quick Ratio | 0.38 | 0.38 | 0.32 |
| Financial Leverage | 7.11 | 7.67 | 8.56 |
The company's balance sheet displays relatively low leverage with insubstantial debt levels, contributing to a solid financial structure.
Fundamental Strength & Profitability
Assessing the fundamental strengths highlights the company's operational efficiency and its profitability margins, which are crucial drivers for long-term growth.
| Year | 2024 | 2023 | 2022 |
|---|---|---|---|
| Return on Equity | 17.72% | 17.03% | 15.95% |
| Return on Assets | 2.52% | 2.22% | 1.86% |
| Margins: Net | 14.03% | 13.54% | 13.53% |
| EBIT | 17.93% | 18.76% | 18.12% |
| EBITDA | 19.14% | 19.04% | 20.45% |
| Gross | 85.44% | 88.28% | 96.37% |
| Research & Development to Revenue | 0% | 0% | 0% |
The profitability and efficiency metrics reflect well-managed operation strategies, ensuring ongoing business growth and competitive advantage.
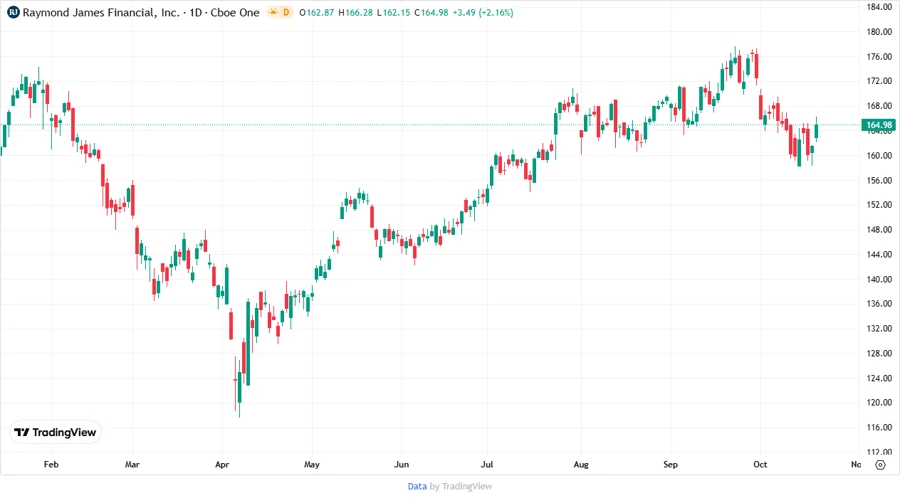
Price Development
⚖️ Dividend Scoring System
| Criteria | Score | Bar |
|---|---|---|
| Dividend yield | 2/5 | |
| Dividend Stability | 4/5 | |
| Dividend Growth | 3/5 | |
| Payout Ratio | 5/5 | |
| Financial Stability | 4/5 | |
| Dividend Continuity | 4/5 | |
| Cashflow Coverage | 4/5 | |
| Balance Sheet Quality | 3/5 |
Total Score: 29/40
✅ Rating
Raymond James Financial, Inc. demonstrates a robust dividend structure with moderate growth potential. Its financial metrics reflect an ability to sustain dividends while maintaining sound capital allocation strategies. Despite a recent reduction, continued stability in cash flow and balance sheet management affirms its viability as a dividend-paying stock. This stock is recommended for conservative investors seeking reliable, long-term income.