
July 14, 2026 a 06:44 am
RF: Fibonacci Analysis - Regions Financial Corporation
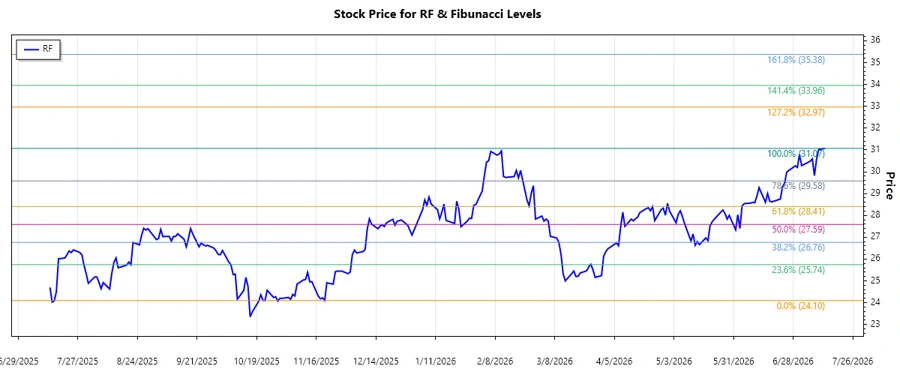
The historical data reveals a clear upward trend in the Regions Financial Corporation stock price over the past months. This resilience is indicative of strong investor confidence and potentially improving fundamentals in the company’s operations. Such a trend often suggests continuing upward momentum, with some expected fluctuations typical of market behavior.
Fibonacci Analysis
| Trend Start Date | Trend End Date | High Price (Date) | Low Price (Date) |
|---|---|---|---|
| 2025-11-19 | 2026-07-13 | $31.07 (2026-07-13) | $24.1 (2025-11-20) |
| Fibonacci Level | Price Level |
|---|---|
| 0.236 | $29.64 |
| 0.382 | $28.56 |
| 0.5 | $27.59 |
| 0.618 | $26.61 |
| 0.786 | $25.45 |
The current stock price is within the 0.236 Fibonacci retracement zone. This level may signify a potential consolidation area, serving as a temporary support before the subsequent movement. Technical analysis suggests this region could provide a buying opportunity if the stock consolidates, reflecting investor sentiment.
Conclusion
Regions Financial Corporation's stock displays a robust upward trajectory, suggesting stability and potential for further growth. However, market conditions and economic factors could introduce volatility. Investors should weigh the strategic advantages offered by the firm's diverse banking and financial services against the inherent risks of market fluctuations. The identified Fibonacci retracement levels may offer critical zones for price reversals or continuations. Analysts must continually monitor economic indicators and company performance to evaluate the sustainability of this trend and recommend strategic actions accordingly.
Smart Data Insight
Master the Perfect Entry & Exit for this Stock
Don't leave your profits to chance. Historically, this stock follows specific seasonal patterns that institutional traders use to maximize returns.
- ✅ Identify the "Golden Buying Window"
- ✅ Avoid high-risk correction cycles
- ✅ Backtested data from the last 20+ years