June 27, 2026 a 03:31 pm


📊 Dividend Analysis - Regions Financial Corporation
This analysis delves into the intricate dividend profile of Regions Financial Corporation, showcasing its long-standing and robust dividend history. With a consistent dividend growth strategy, this corporation highlights a commitment to shareholder returns. Yet, the nuances in payout ratios and market responsiveness warrant a closer inspection for any potential investment shifts.
Overview
The following table provides an overview of the key dividend metrics for Regions Financial Corporation:
| Sector | Dividend Yield | Current Dividend Per Share | Dividend History | Last Cut/Suspension |
|---|---|---|---|---|
| Financial Services | 3.88% | 1.15 USD | 41 years | None |
Dividend History
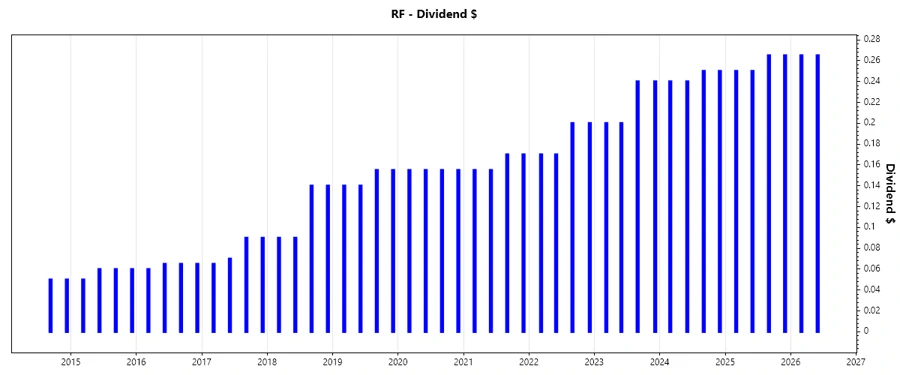
Understanding the dividend distribution across the years provides insights into the corporation's commitment to consistent shareholder returns. The history demonstrates Regions Financial Corporation's dedication to maintaining a stable and growing dividend yield.
| Year | Dividend Per Share (USD) |
|---|---|
| 2026 | 0.53 |
| 2025 | 1.03 |
| 2024 | 0.98 |
| 2023 | 0.88 |
| 2022 | 0.74 |
Dividend Growth
The growth of dividends over the years is a crucial indicator of the company's financial strategy and stability. Regions Financial Corporation shows a modest but steadfast dividend growth.
| Time | Growth |
|---|---|
| 3 years | 11.65% |
| 5 years | 10.69% |
The average dividend growth is 10.69% over 5 years. This shows moderate but steady dividend growth.
Payout Ratio
Payout ratios are critical for evaluating whether dividends are sustainable relative to earnings and free cash flow.
| Key Figure Ratio | Value |
|---|---|
| EPS-based | 44.46% |
| Free cash flow-based | 50.09% |
A payout ratio of 44.46% (EPS) and 50.09% (FCF) indicates that the dividends are reasonably sustainable, allowing for potential reinvestment for growth.
Cashflow & Capital Efficiency
Analyzing the company's cash flow and capital efficiency is crucial to assess its ability to cover dividends and invest in growth opportunities.
| Year | 2023 | 2024 | 2025 |
|---|---|---|---|
| Free Cash Flow Yield | 11.86% | 6.74% | 9.07% |
| Earnings Yield | 11.43% | 8.00% | 9.09% |
| CAPEX to Operating Cash Flow | 6.80% | 9.14% | 1.38% |
| Stock-based Compensation to Revenue | 0.00% | 0.00% | 0.00% |
| Free Cash Flow / Operating Cash Flow Ratio | 93.20% | 90.86% | 98.62% |
Regions Financial Corporation shows a strong free cash flow yield and efficient capital allocation mechanisms, generally indicating robust cash flow stability and high capital efficiency.
Balance Sheet & Leverage Analysis
Analyzing leverage and liquidity ratios is essential to determine the company's ability to manage debt and operational liabilities.
| Year | 2023 | 2024 | 2025 |
|---|---|---|---|
| Debt-to-Equity | 13.37% | 36.32% | 25.65% |
| Debt-to-Assets | 1.53% | 4.13% | 3.06% |
| Debt-to-Capital | 11.79% | 26.64% | 20.41% |
| Net Debt to EBITDA | -1.57 | -1.69 | -2.15 |
| Current Ratio | 27.80% | 27.11% | 29.99% |
| Quick Ratio | 27.80% | 27.11% | 29.99% |
| Financial Leverage | 8.73 | 8.80 | 8.38 |
Regions Financial Corporation maintains a conservative debt structure with adequate liquidity, reflecting financial stability and prudent leverage management.
Fundamental Strength & Profitability
Examining key profitability metrics offers insights into the corporation's operational efficiency and effectiveness in generating profits from its equity and assets.
| Year | 2023 | 2024 | 2025 |
|---|---|---|---|
| Return on Equity | 11.90% | 10.59% | 11.32% |
| Return on Assets | 1.36% | 1.20% | 1.35% |
| Margins: Net | 22.66% | 20.20% | 22.44% |
| Margins: EBIT | 28.48% | 25.11% | 28.55% |
| Margins: EBITDA | 31.06% | 26.65% | 29.19% |
| Margins: Gross | 76.73% | 70.37% | 74.64% |
| R&D to Revenue | 0.00% | 0.00% | 0.00% |
Regions Financial Corporation exhibits solid profitability with consistent returns, indicative of sound management practices and effective resource utilization.
Price Development
Dividend Scoring System
| Criteria | Score | Representation |
|---|---|---|
| Dividend Yield | 4 | |
| Dividend Stability | 5 | |
| Dividend Growth | 4 | |
| Payout Ratio | 4 | |
| Financial Stability | 4 | |
| Dividend Continuity | 5 | |
| Cashflow Coverage | 4 | |
| Balance Sheet Quality | 4 |
Overall Score: 34/40
Rating
Regions Financial Corporation is a strong contender for dividend-focused portfolios, reflecting high dividend stability, reasonable yield, and robust financial health. Investors seeking sustainable income may find this stock a worthy addition. 🟢
Smart Data Insight
Master the Perfect Entry & Exit for this Stock
Don't leave your profits to chance. Historically, this stock follows specific seasonal patterns that institutional traders use to maximize returns.
- ✅ Identify the "Golden Buying Window"
- ✅ Avoid high-risk correction cycles
- ✅ Backtested data from the last 20+ years