April 18, 2026 a 03:31 am

RF: Dividend Analysis - Regions Financial Corporation
Regions Financial Corporation presents a respectable dividend profile highlighted by a consistent dividend yield and a solid dividend history of 41 years. The company's stable financial health makes it an attractive choice for dividend investors. Despite its moderate growth rates, the sustainability of its dividends adds to its appeal. However, attention should be paid to the broader financial conditions influencing the banking sector.
📊 Overview
The assessment of Regions Financial Corporation's dividend overview highlights key metrics that are crucial in understanding the dividend-paying capability of the company. These include sector classification, dividend yield, and remarkable dividend history.
| Key Metric | Value |
|---|---|
| Sector | Financial |
| Dividend Yield | 3.74 % |
| Current Dividend per Share | 1.15 USD |
| Dividend History | 41 years |
| Last Cut or Suspension | None |
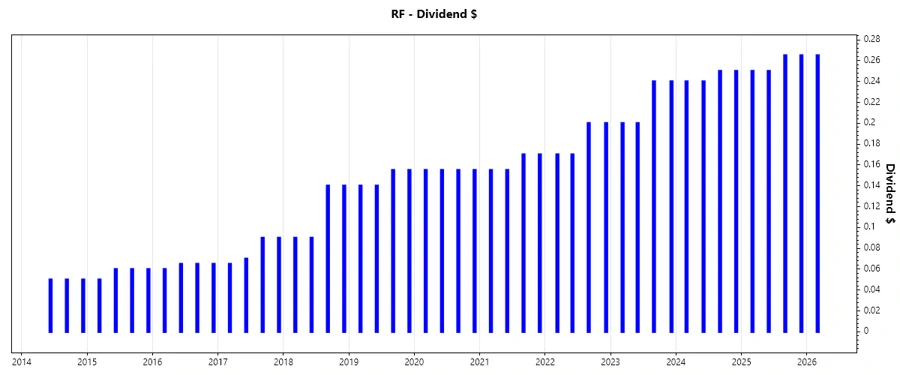
🗣️ Dividend History
Analyzing the dividend history of Regions Financial Corporation is imperative as it reflects the company's commitment to returning value to its shareholders. A reliable dividend history with minimal cuts fosters investor trust and can provide predictable income streams.
| Year | Dividend per Share (USD) |
|---|---|
| 2026 | 0.265 |
| 2025 | 1.030 |
| 2024 | 0.98 |
| 2023 | 0.88 |
| 2022 | 0.74 |
📈 Dividend Growth
The company's dividend growth over recent years exhibits a moderate yet stable increase, underlying its potential for long-term income growth potential. Dividend growth is critical as it protects against inflation and enhances real returns over time.
| Time | Growth |
|---|---|
| 3 years | 11.65 % |
| 5 years | 10.69 % |
The average dividend growth is 10.69% over 5 years. This shows moderate but steady dividend growth.
📉 Payout Ratio
Payout ratios leverage insights into sustainability and capacity for future dividend growth by comparing dividends to earnings and cash flows. Optimum ratios avert risks of underperformance while ensuring sufficient reinvestment in business operations.
| Key Figure | Ratio |
|---|---|
| EPS-based | 43.99 % |
| Free Cash Flow-based | 45.57 % |
With an EPS-based payout ratio at 43.99% and a free cash flow-based payout of 45.57%, Regions Financial Corporation maintains a balanced approach, providing assurance of its dividend sustainability.
✅ Cashflow & Capital Efficiency
Evaluating cash flow and capital efficiency measures the company's ability to generate & efficiently utilize cash to pay dividends and reinvest in growth. This analysis is paramount to identify a firm's operational profitability and long-term solvency.
| Metric | 2025 | 2024 | 2023 |
|---|---|---|---|
| Free Cash Flow Yield | 9.20 % | 6.74 % | 11.86 % |
| Earnings Yield | 9.09 % | 8.79 % | 11.43 % |
| CAPEX to Operating Cash Flow | 1.47 % | 9.14 % | 6.80 % |
| Stock-based Compensation to Revenue | 0.28 % | 0 % | 0 % |
| Free Cash Flow / Operating Cash Flow Ratio | 100 % | 90.86 % | 93.20 % |
| Return on Invested Capital | 13.79 % | 6.37 % | 8.50 % |
The stability in cash flow and efficient capital employment suggest robust operational health, supporting sustained dividend issuance and future capital reinvestments.
⚠️ Balance Sheet & Leverage Analysis
An analysis of balance sheet metrics offers insights into financial stability, liquidity, and leverage. It's indicative of the company's capability to meet its financial obligations and the potential risk with debt management.
| Metric | 2025 | 2024 | 2023 |
|---|---|---|---|
| Debt-to-Equity | 25.65 % | 36.32 % | 13.37 % |
| Debt-to-Assets | 3.06 % | 4.13 % | 1.53 % |
| Debt-to-Capital | 20.41 % | 26.64 % | 11.79 % |
| Net Debt to EBITDA | -2.15 | -1.69 | -1.57 |
| Current Ratio | 0.30 | 0.27 | 0.28 |
| Quick Ratio | 0.30 | 0.27 | 0.28 |
| Financial Leverage | 8.38 | 8.80 | 8.73 |
The balance sheet ratios underscore the company's low leverage, financial resilience, and effective risk management, supporting its capacity to uphold dividend payments in turbulent times.
✅ Fundamental Strength & Profitability
Fundamental and profitability performance reflects operational efficiency and financial health, highlighting value creation from shareholders' investments and resultant profitability margins.
| Metric | 2025 | 2024 | 2023 |
|---|---|---|---|
| Return on Equity | 11.32 % | 10.59 % | 11.90 % |
| Return on Assets | 1.35 % | 1.20 % | 1.36 % |
| Net Margin | 22.44 % | 20.20 % | 22.66 % |
| EBIT Margin | 28.55 % | 25.11 % | 28.48 % |
| EBITDA Margin | 29.19 % | 26.65 % | 31.06 % |
| Gross Margin | 74.64 % | 70.37 % | 76.73 % |
| R&D to Revenue | 0 % | 0 % | 0 % |
The profitability displayed by high margins and robust returns indicates the company's competitive strength and effective cost management, contributing to sustainable dividend yields.
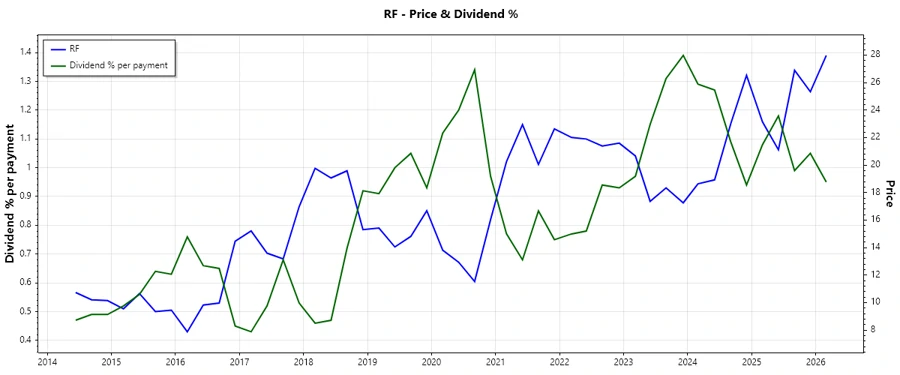
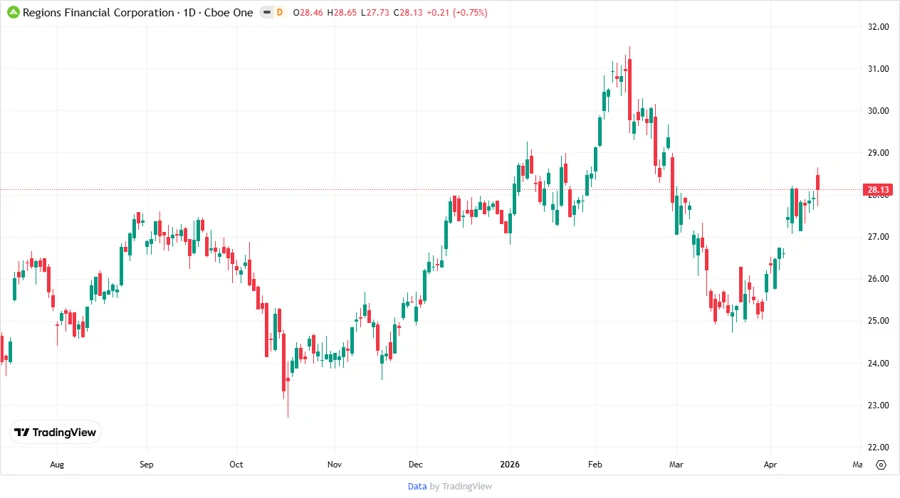
📉 Price Development
📊 Dividend Scoring System
| Category | Score | Rating |
|---|---|---|
| Dividend Yield | 3 | |
| Dividend Stability | 5 | |
| Dividend Growth | 3 | |
| Payout Ratio | 4 | |
| Financial Stability | 4 | |
| Dividend Continuity | 5 | |
| Cashflow Coverage | 4 | |
| Balance Sheet Quality | 5 |
Total Score: 33/40
📈 Rating
In conclusion, Regions Financial Corporation demonstrates commendable financial and dividend-paying capability. With a total score of 33 out of 40, it is recommended as a promising choice for income-seeking investors, given its consistent dividend payments, strong fundamentals, and solid balance sheet.