February 26, 2026 a 11:31 am

RF: Dividend Analysis - Regions Financial Corporation
Regions Financial Corporation presents a moderate dividend yield with a consistent history of payouts, indicating a stable income opportunity for investors. The company's EPS and FCF payout ratios suggest a balanced approach to dividend disbursement, prioritizing sustainability. The steady growth in dividends over the years reflects positive management commitment to shareholder returns.
📊 Overview
Regions Financial Corporation operates in the financial sector, known for its significant dividend reliability...
| Metric | Value |
|---|---|
| Sector | Financial |
| Dividend yield | 3.60 % |
| Current dividend per share | 1.04 USD |
| Dividend history | 41 years |
| Last cut or suspension | None |
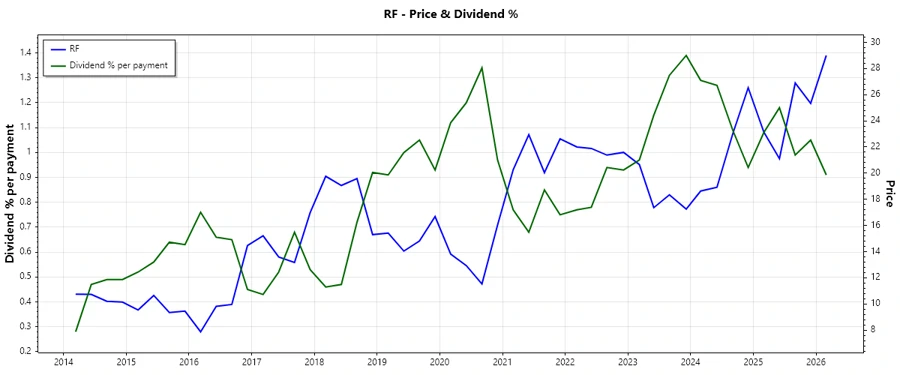
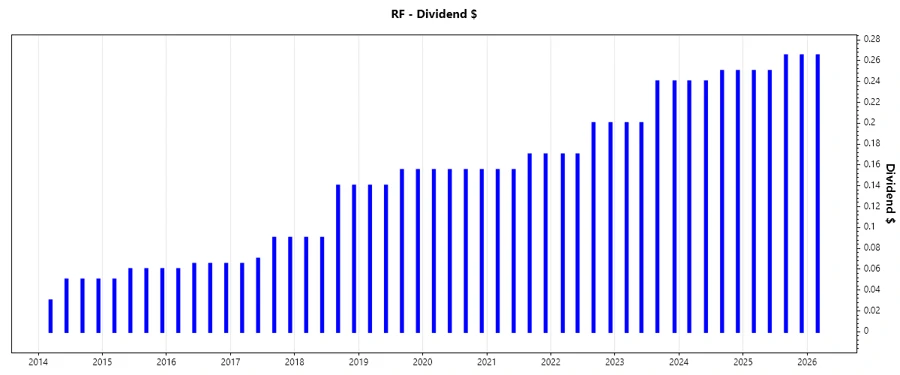
📉 Dividend History
The 41-year dividend history of Regions Financial Corporation signifies a robust commitment to returning capital to shareholders...
| Year | Dividend Per Share |
|---|---|
| 2026 | 0.265 |
| 2025 | 1.030 |
| 2024 | 0.980 |
| 2023 | 0.880 |
| 2022 | 0.740 |
📈 Dividend Growth
Understanding the dividend growth is critical for investors aiming for income escalation over time...
| Time | Growth |
|---|---|
| 3 years | 11.65 % |
| 5 years | 10.68 % |
The average dividend growth is 10.68 % over 5 years. This shows moderate but steady dividend growth.
🗣️ Payout Ratio
Payout ratios, including EPS and FCF, serve as a crucial measure of the company's ability to maintain or grow their dividend...
| Key figure | Ratio |
|---|---|
| EPS-based | 42.30 % |
| Free cash flow-based | 42.53 % |
The EPS payout ratio shows a sustainable level, ensuring dividend continuity without compromising financial stability.
💼 Cashflow & Capital Efficiency
Examining cash flow metrics reveals insights into the company’s liquidity and capital operational efficiency...
| Year | 2025 | 2024 | 2023 |
|---|---|---|---|
| Free Cash Flow Yield | 9.20 % | 6.74 % | 11.86 % |
| Earnings Yield | 9.09 % | 8.79 % | 11.43 % |
| CAPEX to Operating Cash Flow | 0.00 % | 9.14 % | 6.80 % |
| Stock-based Compensation to Revenue | 0 % | 0 % | 0 % |
| Free Cash Flow / Operating Cash Flow Ratio | 1.00 | 0.91 | 0.93 |
Strong cash flow performance supports the company's operational needs and facilitates dividend payments with consistency.
⚠️ Balance Sheet & Leverage Analysis
Analyzing leverage ratios stabilizes insights into financial risks due to indebtedness...
| Year | 2025 | 2024 | 2023 |
|---|---|---|---|
| Debt-to-Equity | 0.26 | 0.36 | 0.13 |
| Debt-to-Assets | 0.03 | 0.04 | 0.02 |
| Debt-to-Capital | 0.20 | 0.27 | 0.12 |
| Net Debt to EBITDA | -2.15 | -1.69 | -1.57 |
| Current Ratio | 0.30 | 0.27 | 0.28 |
| Quick Ratio | 0.30 | 0.27 | 0.28 |
| Financial Leverage | 8.38 | 8.80 | 8.73 |
The company presents a controlled leverage positioning, with significant safety in assets surpassing liabilities.
✅ Fundamental Strength & Profitability
Examining fundamentals such as ROE, ROA, and profitability margins provides a snapshot of operational efficiency...
| Year | 2025 | 2024 | 2023 |
|---|---|---|---|
| Return on Equity | 11.32 % | 10.59 % | 11.90 % |
| Return on Assets | 1.35 % | 1.20 % | 1.36 % |
| Margins: Net | 22.44 % | 20.20 % | 22.66 % |
| Margins: EBIT | 28.55 % | 25.11 % | 28.48 % |
| Margins: EBITDA | 29.19 % | 26.65 % | 31.06 % |
| Margins: Gross | 74.64 % | 70.37 % | 76.73 % |
| Research & Development to Revenue | 0 % | 0 % | 0 % |
The robust profitability margins and returns indicate a disciplined approach to expense management and revenue generation.
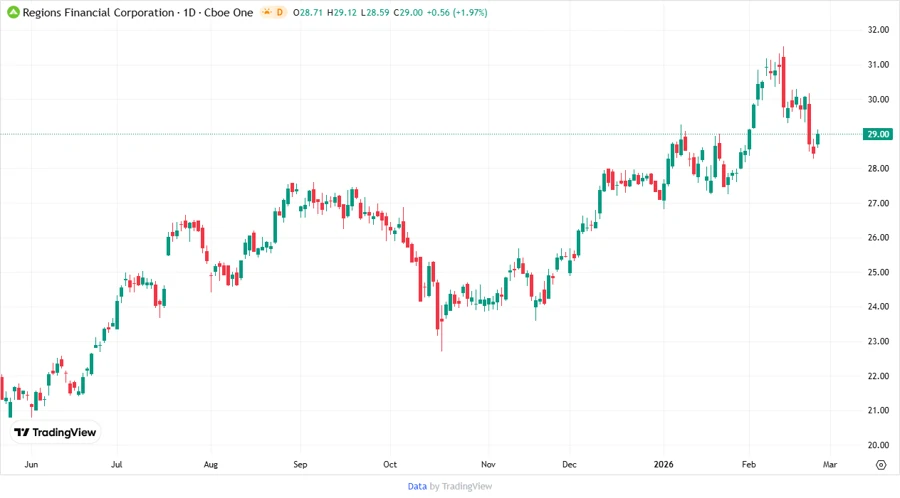
📈 Price Development
💯 Dividend Scoring System
| Criteria | Score | Bar |
|---|---|---|
| Dividend yield | 4 | |
| Dividend Stability | 5 | |
| Dividend growth | 4 | |
| Payout ratio | 4 | |
| Financial stability | 4 | |
| Dividend continuity | 5 | |
| Cashflow Coverage | 4 | |
| Balance Sheet Quality | 4 |
Overall Score: 34/40
📝 Rating
Regions Financial Corporation exhibits a robust dividend profile supported by a stable financial framework and consistent growth strategies, making it an attractive option for dividend investors seeking reliability and gradual appreciation.