February 13, 2026 a 02:47 am


RF: Dividend Analysis - Regions Financial Corporation
Regions Financial Corporation offers a consistent dividend profile with a 3.51% yield, supported by decades of stable dividend histories and prudent financial management. Its low payout ratios suggest a sustainable dividend, while historical growth highlights a commitment to returning capital to shareholders. Despite lower recent dividend growth, the company's robust capital position warrants attention.
📊 Overview
The Regions Financial Corporation operates in a dynamic sector, influenced by macroeconomic shifts. Its attractive dividend yield of 3.51% and a substantial 41 years of dividend payment record underline a stable shareholder return approach.
| Data | Value |
|---|---|
| Sector | Financial Services |
| Dividend yield | 3.51% |
| Current dividend per share | 1.03 USD |
| Dividend history | 41 years |
| Last cut or suspension | None |
🗓️ Dividend History
A prolonged dividend-paying track record is crucial for income-focused investors. The historical payment data signals financial resilience even through market volatility.
| Year | Dividend per Share (USD) |
|---|---|
| 2026 | 0.265 |
| 2025 | 1.03 |
| 2024 | 0.98 |
| 2023 | 0.88 |
| 2022 | 0.74 |
📈 Dividend Growth
Analyzing the growth pattern offers insight into the management's future outlook and capacity for enhancing shareholder value. A consistent increase reflects operational strength and growth intent.
| Time | Growth |
|---|---|
| 3 years | 11.65% |
| 5 years | 10.69% |
The average dividend growth is 10.69% over 5 years. This shows moderate but steady dividend growth.
💼 Payout Ratio
The payout ratio helps assess dividend sustainability by comparing earnings against payments. A lower ratio often suggests a cushion for future payments or reinvestment.
| Key figure | Ratio |
|---|---|
| EPS-based | 41.80% |
| Free cash flow-based | 40.25% |
With a 41.80% payout from EPS and 40.25% from free cash flow, the ratios portray a balanced approach, indicating room for either dividend consistency or future expansion.
🔍 Cashflow & Capital Efficiency
Effective cash flow management sustains operational excellence and investor confidence. Analyzing efficiency ratios reveals how astutely resources are utilized.
| Metric | 2025 | 2024 | 2023 |
|---|---|---|---|
| Free Cash Flow Yield | - | 6.74% | 11.86% |
| Earnings Yield | 9.09% | 8.79% | 11.43% |
| CAPEX to Operating Cash Flow | - | 9.14% | 6.80% |
| Stock-based Compensation to Revenue | 0.00% | 0.00% | 0.00% |
| Free Cash Flow / Operating Cash Flow Ratio | 0% | 90.86% | 93.20% |
Cash flow metrics, especially the stability of free cash flow yield, affirm the firm's efficient capital allocation and robust financial posture.
📉 Balance Sheet & Leverage Analysis
Assessing debt metrics and liquidity ratios provides insights into the company’s solvency and risk management framework.
| Metric | 2025 | 2024 | 2023 |
|---|---|---|---|
| Debt-to-Equity | 0.26 | 0.36 | 0.13 |
| Debt-to-Assets | 0.03 | 0.04 | 0.02 |
| Debt-to-Capital | 0.20 | 0.27 | 0.12 |
| Net Debt to EBITDA | -2.15 | -1.69 | -1.57 |
| Current Ratio | 0.30 | - | - |
| Quick Ratio | 0.30 | 0.27 | 0.28 |
| Financial Leverage | 8.38 | 8.80 | 8.73 |
The low debt levels and healthy leverage ratios suggest a well-managed capital structure with ample capacity for meeting obligations and potential growth.
✅ Fundamental Strength & Profitability
Profitability metrics highlight the firm’s efficiency in converting revenue to profit, crucial for assessing operational effectiveness.
| Metric | 2025 | 2024 | 2023 |
|---|---|---|---|
| Return on Equity | 11.32% | 10.59% | 11.90% |
| Return on Assets | 1.35% | 1.20% | 1.36% |
| Margins: Net | 22.4% | 20.2% | 22.7% |
| EBIT | 28.5% | 25.1% | 28.5% |
| EBITDA | 29.2% | 26.6% | 31.1% |
| Gross | 74.6% | 70.4% | 76.7% |
| Research & Development to Revenue | 0% | 0% | 0% |
Stable profitability metrics, particularly the return on equity and various margins, accentuate the strategic competence and operational efficacy of Regions Financial Corporation.
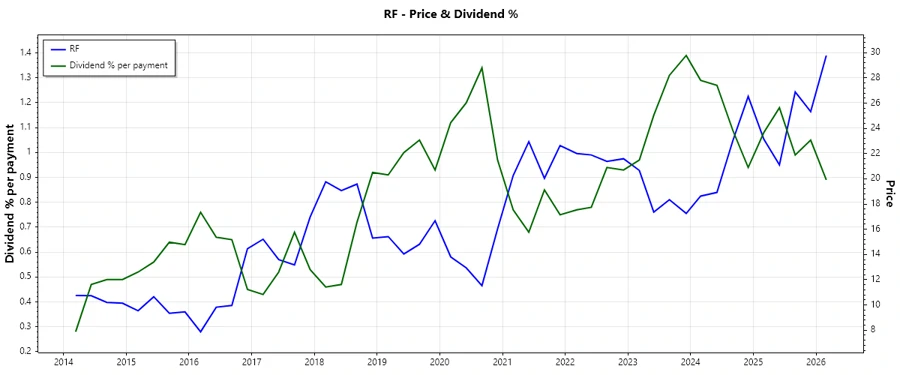
📊 Price Development
🔍 Dividend Scoring System
| Criteria | Score | Score Bar |
|---|---|---|
| Dividend yield | 4 | |
| Dividend Stability | 5 | |
| Dividend growth | 3 | |
| Payout ratio | 4 | |
| Financial stability | 5 | |
| Dividend continuity | 5 | |
| Cashflow Coverage | 4 | |
| Balance Sheet Quality | 5 |
Total Score: 35/40
📋 Rating
The comprehensive dividend and financial analysis of Regions Financial Corporation underlines its robust dividend approach and operational effectiveness. The company emerges as a strong dividend player with commendable financial stability, offering moderate growth prospects but ensuring consistent returns. This positions RF as a favorable option for income-seeking investors.