November 11, 2025 a 03:31 pm


RF: Dividend Analysis - Regions Financial Corporation
Regions Financial Corporation, a mainstream financial services provider, has been consistently delivering dividends for 40 years, supporting investor confidence with significant yield and growth. Despite market fluctuations, its strong foundation and disciplined approach offer a resilient dividend profile, making it an attractive option for income-focused investors.
📊 Overview
Regions Financial Corporation operates in the financial sector with a notable dividend profile, characterized by a substantial yield and a lengthy history of dividend payouts.
| Metric | Detail |
|---|---|
| Sector | Financial |
| Dividend Yield | 4.11% |
| Current Dividend per Share | 1.09 USD |
| Dividend History | 40 years |
| Last Cut or Suspension | 2010 |
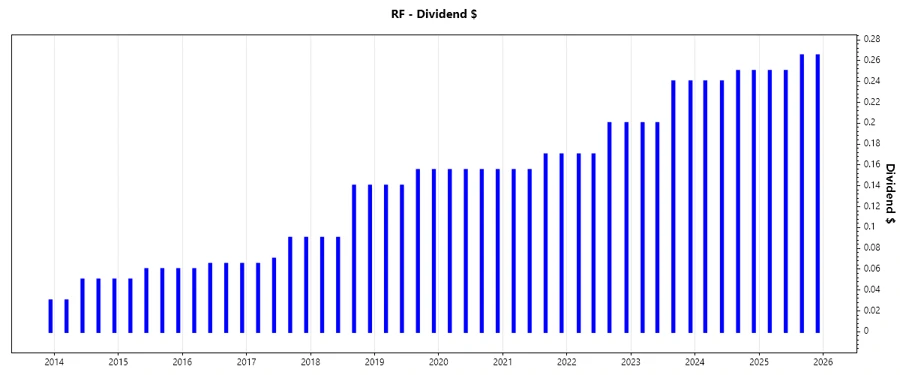
📉 Dividend History
Regions Financial Corporation has demonstrated stability and resilience in its dividend payments, sustaining investor interest through varied economic cycles. This adherence to dividend tradition strengthens shareholders' trust and provides predictable income streams.
| Year | Dividend per Share (USD) |
|---|---|
| 2025 | 1.030 |
| 2024 | 0.980 |
| 2023 | 0.880 |
| 2022 | 0.740 |
| 2021 | 0.650 |
📈 Dividend Growth
The dividend growth analysis demonstrates Regions Financial Corporation's strategic commitment to enhancing shareholder value through steadily increasing dividends, indicative of its sound financial health and efficient capital allocation.
| Time | Growth |
|---|---|
| 3 years | 14.67% |
| 5 years | 10.68% |
The average dividend growth is 10.68% over 5 years. This shows moderate but steady dividend growth.
🗣️ Payout Ratio
Payout ratios provide insight into Regions Financial Corporation's ability to maintain and potentially increase dividends. A balanced payout ratio indicates effective earnings utilization and sustainable dividend distribution.
| Key figure | Ratio |
|---|---|
| EPS-based | 43.91% |
| Free Cash Flow-based | 43.45% |
A payout ratio of 43.91% (EPS) and 43.45% (FCF) reflects a balanced approach, indicating that dividends are well-covered by earnings and cash flow, allowing room for further growth or market condition adjustments.
✅ Cashflow & Capital Efficiency
Analyzing cash flow metrics and capital efficiency ratios reveals Regions Financial Corporation's operational robustness and its ability to generate and allocate resources effectively. These factors are critical for sustaining dividend payments and potential growth.
| Year | 2024 | 2023 | 2022 |
|---|---|---|---|
| Free Cash Flow Yield | 6.74% | 11.86% | 13.96% |
| Earnings Yield | 8.79% | 11.43% | 11.14% |
| CAPEX to Operating Cash Flow | 9.13% | 6.80% | 9.28% |
| Stock-based Compensation to Revenue | 0.00% | 0.00% | 0.00% |
| Free Cash Flow / Operating Cash Flow Ratio | 90.86% | 91.60% | 90.72% |
The financials indicate strong cash flow generation relative to operations, suggesting that Regions Financial Corporation maintains a solid foundation for continued dividend disbursement and strategic reinvestment.
⚠️ Balance Sheet & Leverage Analysis
Regions Financial Corporation's balance sheet health and leverage metrics provide insights into its financial stability and ability to manage debt obligations, crucial for long-term operations and strategic ventures.
| Year | 2024 | 2023 | 2022 |
|---|---|---|---|
| Debt-to-Equity | 36.32% | 13.37% | 14.32% |
| Debt-to-Assets | 4.13% | 1.53% | 1.47% |
| Debt-to-Capital | 26.64% | 11.79% | 12.53% |
| Net Debt to EBITDA | -168.90% | -157.26% | -276.96% |
| Current Ratio | 0.00 | 0.00 | 0.00 |
| Quick Ratio | 27.11% | 27.80% | 30.11% |
| Financial Leverage | 879.81% | 873.22% | 973.35% |
The leverage ratios suggest prudent debt management, reinforcing financial stability necessary for consistent dividend policies. The low debt-to-equity ratio and high financial leverage reflect strategic capital use.
🗣️ Fundamental Strength & Profitability
Examining key profitability ratios unveils Regions Financial Corporation's operational efficacy and its ability to generate substantial returns, pivotal for dividend sustainability and investor appeal.
| Year | 2024 | 2023 | 2022 |
|---|---|---|---|
| Return on Equity | 10.59% | 11.90% | 14.08% |
| Return on Assets | 1.20% | 1.36% | 1.45% |
| Margins: Net | 20.20% | 22.66% | 30.01% |
| EBIT Margin | 25.11% | 28.48% | 38.44% |
| EBITDA Margin | 26.65% | 31.06% | 43.16% |
| Gross Margin | 70.37% | 76.73% | 92.15% |
| Research & Development to Revenue | 0.00% | 0.00% | 0.00% |
The robust return on equity and high net margins demonstrate strong profitability and operational efficiency, essential for maintaining competitive dividends.
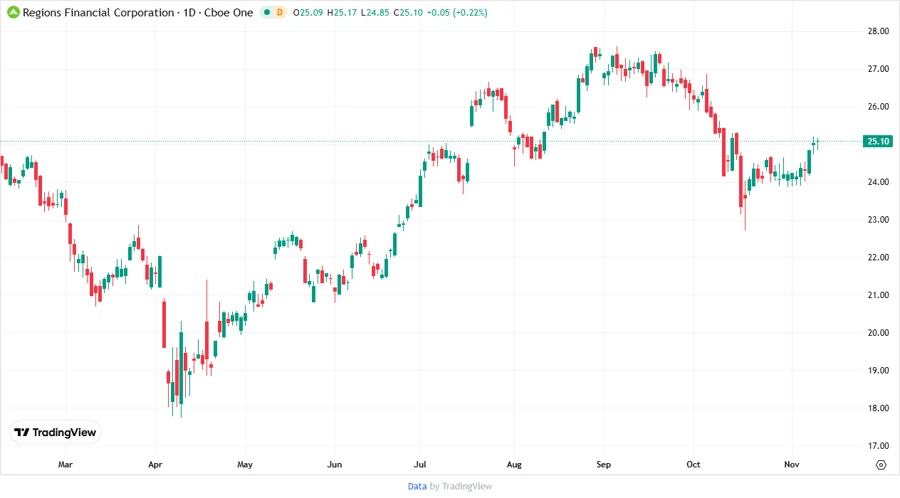
💹 Price Development
✅ Dividend Scoring System
| Category | Score | Rating |
|---|---|---|
| Dividend Yield | 4 | |
| Dividend Stability | 5 | |
| Dividend Growth | 4 | |
| Payout Ratio | 4 | |
| Financial Stability | 4 | |
| Dividend Continuity | 5 | |
| Cashflow Coverage | 4 | |
| Balance Sheet Quality | 3 |
Total Score: 33/40
🗣️ Rating
Regions Financial Corporation demonstrates notable dividend consistency and growth potential. With a balanced payout ratio and strong financial metrics, it remains a viable option for dividend-focused investors. The company’s robust dividend history and favorable scores in yield, stability, and financial prudence endorse its stature as a stable income investment.
Smart Data Insight
Master the Perfect Entry & Exit for this Stock
Don't leave your profits to chance. Historically, this stock follows specific seasonal patterns that institutional traders use to maximize returns.
- ✅ Identify the "Golden Buying Window"
- ✅ Avoid high-risk correction cycles
- ✅ Backtested data from the last 20+ years