September 15, 2025 a 03:32 am


RF: Dividend Analysis - Regions Financial Corporation
Regions Financial Corporation presents itself as a reliable dividend-paying stock with a strong history of 40 years of dividend distribution. Despite moderate dividend yield of 3.77%, the company shows stable performance supported by a solid financial backdrop. The absence of recent dividend cuts or suspensions highlights the company's commitment to returning value to shareholders.
📊 Overview
Regions Financial Corporation operates within the financial sector, offering a dividend yield of 3.77%. The current dividend per share is 1.085 USD, and the company boasts a robust history of 40 years. Notably, there have been no recent cuts or suspensions.
| Sector | Dividend Yield | Current Dividend per Share | Dividend History | Last Cut or Suspension |
|---|---|---|---|---|
| Financial | 3.77% | 1.085 USD | 40 years | None |
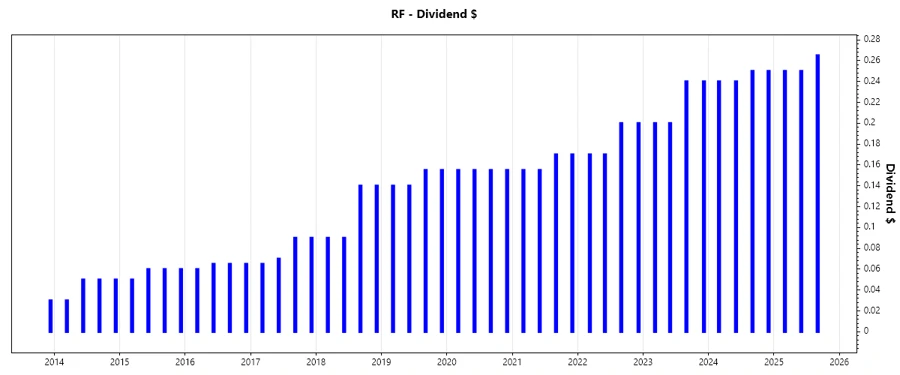
📈 Dividend History
The dividend history is crucial for understanding the company's track record and its commitment to shareholder returns. Maintaining a consistent or growing dividend payout history often reflects positively on the company's financial health and management's confidence in future earnings.
| Year | Dividend per Share (USD) |
|---|---|
| 2025 | 0.765 |
| 2024 | 0.98 |
| 2023 | 0.88 |
| 2022 | 0.74 |
| 2021 | 0.650 |
📉 Dividend Growth
Dividend growth is a key indicator of financial strength and a company’s dedication to returning cash to its shareholders. Regions Financial Corporation exhibits a 14.67% growth over three years and 10.68% over five years, indicative of a sustained upward trend in dividend payouts.
| Time | Growth |
|---|---|
| 3 years | 14.67% |
| 5 years | 10.68% |
The average dividend growth is 10.68% over 5 years. This shows moderate but steady dividend growth.
✅ Payout Ratio
The payout ratio provides insight into the sustainability of dividend payments. An EPS-based payout ratio of 47.13% and a FCF-based payout ratio of 36.66% suggest that Regions Financial Corporation maintains a sustainable dividend payout policy, ensuring earnings are adequately reinvested for future growth.
| Key Figure Ratio | Percentage |
|---|---|
| EPS-based | 47.13% |
| Free cash flow-based | 36.66% |
A payout ratio below 50% indicates ample opportunity for reinvestment and suggests that dividends are well-covered by earnings and free cash flow.
💡 Cashflow & Capital Efficiency
Analyzing cash flow and capital efficiency is essential for determining how effectively Regions Financial is utilizing its resources to generate cash. The free cash flow yield, earnings yield, and CAPEX to operating cash flow demonstrate the company's ability to maintain operational efficiency while investing in future growth.
| Year | 2022 | 2023 | 2024 |
|---|---|---|---|
| Free Cash Flow Yield | 13.96% | 11.86% | 6.74% |
| Earnings Yield | 11.14% | 11.43% | 8.79% |
| CAPEX to Operating Cash Flow | 9.28% | 6.80% | 9.14% |
| Stock-based Compensation to Revenue | 0% | 0% | 0% |
| Free Cash Flow / Operating Cash Flow Ratio | 90.72% | 93.20% | 90.86% |
Regions Financial demonstrates strong cash flow generation and capital efficiency, ensuring the firm can fund operations, continue payouts, and invest back into the business.
🔍 Balance Sheet & Leverage Analysis
The balance sheet and leverage analysis indicate Regions Financial's capacity to manage debt and sustain financial stability. Metrics such as debt-to-equity, current ratio, and net debt to EBITDA provide insight into the firm's financial health.
| Year | 2022 | 2023 | 2024 |
|---|---|---|---|
| Debt-to-Equity | 14.32% | 13.37% | 36.32% |
| Debt-to-Assets | 1.47% | 1.53% | 4.13% |
| Debt-to-Capital | 12.53% | 11.79% | 26.64% |
| Net Debt to EBITDA | -2.77 | -1.57 | -1.69 |
| Current Ratio | 30.11% | 27.80% | 27.11% |
| Quick Ratio | 30.11% | 27.80% | 27.11% |
| Financial Leverage | 9.73 | 8.73 | 8.80 |
The firm's leverage metrics indicate cautious financial management, ensuring strong debt coverage and minimal financial risk.
🔍 Fundamental Strength & Profitability
Fundamental strength and profitability ratios demonstrate the company’s effectiveness in generating profit. Metrics such as Return on Equity and Assets, along with margin statistics, reflect financial health and operational efficiency.
| Year | 2022 | 2023 | 2024 |
|---|---|---|---|
| Return on Equity | 14.08% | 11.90% | 10.59% |
| Return on Assets | 1.45% | 1.36% | 1.20% |
| Margins: Net | 30.01% | 22.66% | 20.20% |
| EBIT | 38.44% | 28.48% | 25.11% |
| EBITDA | 43.16% | 31.06% | 26.65% |
| Gross | 92.15% | 76.73% | 70.37% |
| Research & Development to Revenue | 0% | 0% | 0% |
The company's margin efficiency, alongside solid ROE and ROA, solidifies Regions Financial Corporation's profile as a fundamentally strong entity capable of leveraging resources for sustained profitability.
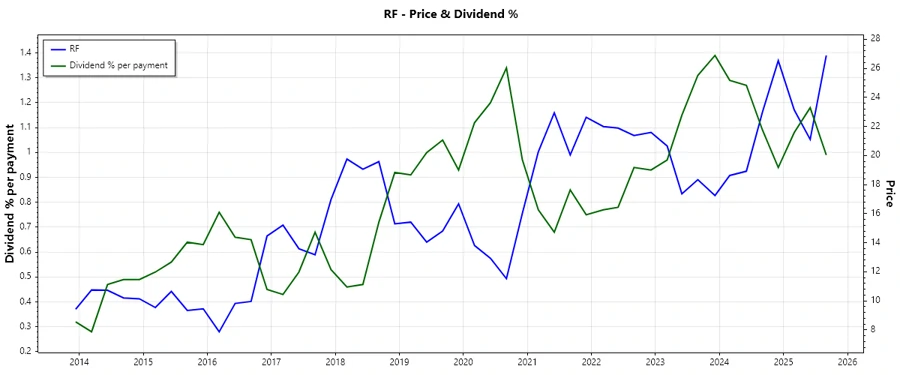
📈 Price Development
🏆 Dividend Scoring System
| Criteria | Score (out of 5) | Score Bar |
|---|---|---|
| Dividend yield | 4 | |
| Dividend Stability | 5 | |
| Dividend growth | 4 | |
| Payout ratio | 4 | |
| Financial stability | 3 | |
| Dividend continuity | 5 | |
| Cashflow Coverage | 4 | |
| Balance Sheet Quality | 4 |
Total Score: 33/40
🏅 Rating
Regions Financial Corporation is recommended as a solid investment based on its strong dividend history and robust financial metrics. With steady dividend growth and a comprehensive payout strategy, it represents a dependable option for dividend-focused investors aiming for long-term gains.
Smart Data Insight
Master the Perfect Entry & Exit for this Stock
Don't leave your profits to chance. Historically, this stock follows specific seasonal patterns that institutional traders use to maximize returns.
- ✅ Identify the "Golden Buying Window"
- ✅ Avoid high-risk correction cycles
- ✅ Backtested data from the last 20+ years