October 10, 2025 a 03:15 am
REG: Trend and Support & Resistance Analysis - Regency Centers Corporation
Regency Centers Corporation, a leading real estate investment trust, operates shopping centers mainly in affluent areas. The stock shows mixed signals with fluctuating trends that might affect short-term investment decisions. Understanding the technical trends alongside support and resistance levels can provide a strategic edge for potential investors.
Trend Analysis
| Date | Close Price | Trend |
|---|---|---|
| 2025-10-09 | $71.33 | ⚖️ |
| 2025-10-08 | $71.26 | ⚖️ |
| 2025-10-07 | $71.48 | ⚖️ |
| 2025-10-06 | $71.14 | ⚖️ |
| 2025-10-03 | $71.68 | ⚖️ |
| 2025-10-02 | $71.88 | ⚖️ |
| 2025-10-01 | $72.09 | ⚖️ |
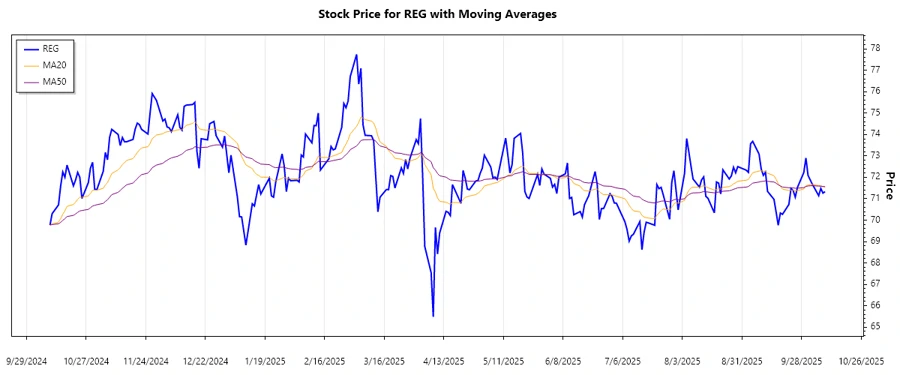
The analysis shows that the EMA20 and EMA50 have been relatively close, indicating a sideways trend. Short-term signals suggest caution as the stock searches for direction.
Support- and Resistance
| Zone Type | From | To |
|---|---|---|
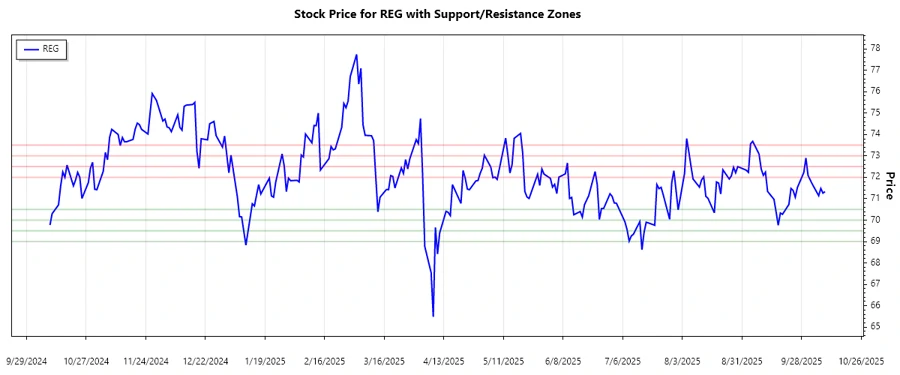
| 🔽 Support 1 | $70.00 | $70.50 |
| 🔽 Support 2 | $69.00 | $69.50 |
| 🔼 Resistance 1 | $72.00 | $72.50 |
| 🔼 Resistance 2 | $73.00 | $73.50 |
The current price hovers around the lower resistance zone. A breakthrough above this level might indicate bullish potential, while failure to sustain could bring the support zones into play.
Conclusion
Regency Centers Corporation's stock exhibits a sideways trend, underscored by its close EMA20 and EMA50 values. The defined support and resistance zones offer key levels for traders to watch. A breakout above resistance might attract more buyers, while any reversal could pressure the stock downwards. The technical indicators suggest cautious optimism, with sustained movements beyond current zones potentially setting a stronger trend.
Smart Data Insight
Master the Perfect Entry & Exit for this Stock
Don't leave your profits to chance. Historically, this stock follows specific seasonal patterns that institutional traders use to maximize returns.
- ✅ Identify the "Golden Buying Window"
- ✅ Avoid high-risk correction cycles
- ✅ Backtested data from the last 20+ years