
October 27, 2025 a 04:45 pm
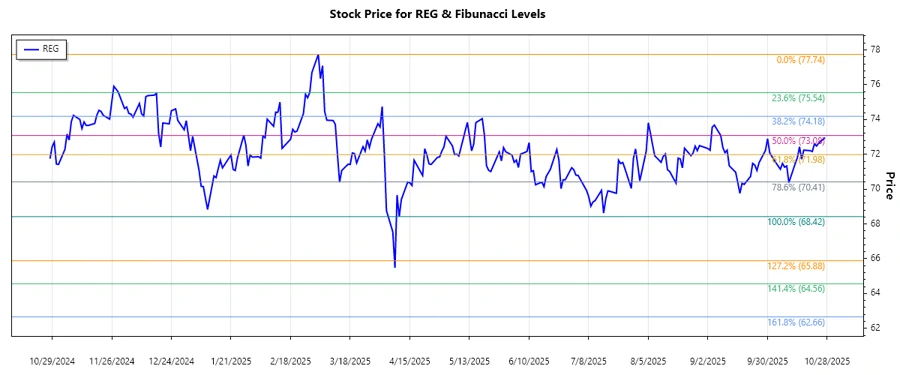
REG: Fibonacci Analysis - Regency Centers Corporation
Regency Centers Corporation has recently shown moderate fluctuations and is currently navigating through complex market conditions. The stock is primarily influenced by the broader economic indicators and consumer spending trends, especially in the retail sector. It holds significant potential for recovery if consumer activity strengthens in affluent neighborhoods where its centers are located. Investors are advised to watch for changes in economic data that may signal stronger consumption patterns.
Fibonacci Analysis
| Parameter | Details |
|---|---|
| Trend Period | March 3, 2025 - October 27, 2025 |
| High Price | $77.74 (March 3, 2025) |
| Low Price | $68.42 (April 10, 2025) |
| Fibonacci 0.236 | $71.00 |
| Fibonacci 0.382 | $72.21 |
| Fibonacci 0.5 | $73.08 |
| Fibonacci 0.618 | $73.95 |
| Fibonacci 0.786 | $75.24 |
| Current Price | $72.96 (October 27, 2025) |
| Retracement Zone | 0.382 |
| Technical Interpretation | The stock currently sits near the 0.382 retracement level, indicating potential support if the price continues to hold above this threshold. |
Conclusion
Regency Centers Corporation exhibits resilience in its price movements, aligning with market trends buoyed by consumer behavior in high-income regions. Despite current market fluctuations, the potential for upward mobility is present if external economic factors such as spending power and employment rates improve. Risks remain if consumer spending contracts. Technically, the stock shows signs of support at current retracement levels, which can indicate stability or a potential reversal opportunity for strategic investors. Observing fiscal policies and market sentiment changes will aid in anticipating future performance.
Smart Data Insight
Master the Perfect Entry & Exit for this Stock
Don't leave your profits to chance. Historically, this stock follows specific seasonal patterns that institutional traders use to maximize returns.
- ✅ Identify the "Golden Buying Window"
- ✅ Avoid high-risk correction cycles
- ✅ Backtested data from the last 20+ years