November 25, 2025 a 11:31 am


REG: Dividend Analysis - Regency Centers Corporation
Regency Centers Corporation has demonstrated a robust dividend profile with a reliable payout history and attractive yield. Despite a high EPS payout ratio, the company shows a stable free cash flow payout, indicating resilience in covering dividends without overstretching its finances. The firm has a remarkable 32 years of dividend history showcasing fiscal discipline and prioritization of shareholder returns.
📊 Overview
Regency Centers Corporation operates in the Real Estate sector, boasting a solid track record in dividend disbursements.
| Metric | Details |
|---|---|
| Sector | Real Estate |
| Dividend Yield | 4.03% |
| Current Dividend per Share | 2.66 USD |
| Dividend History | 32 years |
| Last Cut or Suspension | 2010 |
🗣️ Dividend History
Regency Centers has consistently increased dividends over the years, evidencing its strong operational performance. Staying committed to shareholders despite past economic fluctuations portrays strong fiscal governance.
| Year | Dividend per Share (USD) |
|---|---|
| 2025 | 2.87 |
| 2024 | 2.72 |
| 2023 | 2.62 |
| 2022 | 2.53 |
| 2021 | 2.41 |
📈 Dividend Growth
The company has managed growth rates showing stability over time. Observing the increases over three and five years portrays the company's commitment to enhancing shareholder value.
| Time | Growth |
|---|---|
| 3 years | 4.05% |
| 5 years | 3.02% |
The average dividend growth is 3.02% over 5 years. This shows moderate but steady dividend growth.
🧮 Payout Ratio
The payout ratios reflect Regency Centers' capacity to sustain and grow its dividend through earnings and cash flow.
| Key Figure | Ratio |
|---|---|
| EPS-based | 122.21% |
| Free cash flow-based | 63.52% |
While the EPS-based payout ratio is quite high at 122.21%, the company maintains a more conservative free cash flow-based payout ratio of 63.52%, highlighting better sustainability from cash flows.
💰 Cashflow & Capital Efficiency
Cash flow management underpins the strategic operational framework of Regency Centers, contributing to robust and consistent dividend covers.
| Metric | 2024 | 2023 | 2022 |
|---|---|---|---|
| Free Cash Flow Yield | 5.63% | 6.01% | 6.15% |
| Earnings Yield | 2.85% | 3.04% | 4.50% |
| CAPEX to Operating Cash Flow | 43.45% | 27.14% | 0.75% |
| Stock-based Compensation to Revenue | 1.56% | 1.47% | 1.30% |
| Free Cash Flow / Operating Cash Flow Ratio | 1 | 1 | 1.01 |
The observed positive metrics affirm effective management and control over capital deployment and free cash flow generation, bolstering dividend stability.
🧾 Balance Sheet & Leverage Analysis
Strong financial health stems from prudent debt management, ensuring continous operations amidst varying market conditions.
| Metric | 2024 | 2023 | 2022 |
|---|---|---|---|
| Debt-to-Equity | 0.75 | 0.68 | 0.70 |
| Debt-to-Assets | 0.40 | 0.39 | 0.40 |
| Debt-to-Capital | 0.43 | 0.41 | 0.41 |
| Net Debt to EBITDA | -5.28 | 5.61 | 5.17 |
| Current Ratio | 0.73 | 0.64 | 0.81 |
| Quick Ratio | 0.73 | 0.63 | 0.81 |
| Financial Leverage | 1.84 | 1.77 | 1.78 |
Overall leverage ratios indicate a carefully managed debt profile, contributing to long-term financial soundness and operational agility.
🚀 Fundamental Strength & Profitability
Evaluating key metrics such as return on equity and assets serves as an important indicator of Regency Centers' profitability and operational prowess.
| Metric | 2024 | 2023 | 2022 |
|---|---|---|---|
| Return on Equity | 5.95% | 5.18% | 7.92% |
| Return on Assets | 3.23% | 2.93% | 4.45% |
| Margins: Net | 26.63% | 26.61% | 37.98% |
| EBIT Margin | 37.77% | 37.70% | 40.86% |
| EBITDA Margin | 62.51% | 61.29% | 64.36% |
| Gross Margin | 71.19% | 71.18% | 72.78% |
| R&D to Revenue | 0% | 0% | 0% |
Ample profit margins and effective capital use underscore the firm's adeptness in leveraging its resources for value creation.
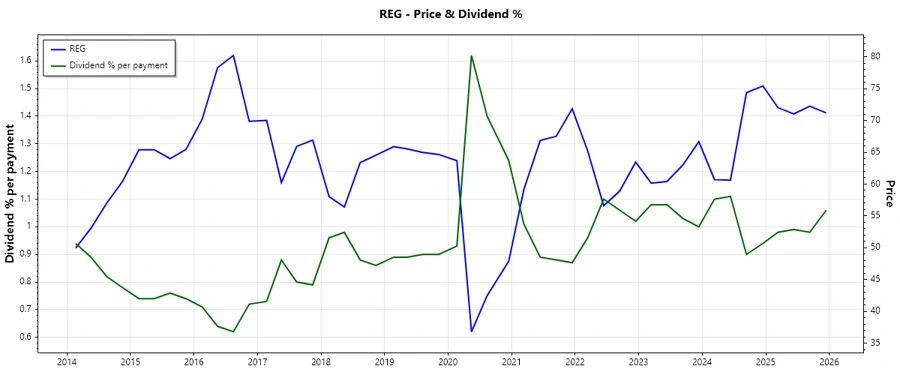
📉 Price Development
✅ Dividend Scoring System
| Category | Score | Bar |
|---|---|---|
| Dividend Yield | 4 | |
| Dividend Stability | 5 | |
| Dividend Growth | 3 | |
| Payout Ratio | 3 | |
| Financial Stability | 4 | |
| Dividend Continuity | 5 | |
| Cashflow Coverage | 4 | |
| Balance Sheet Quality | 4 |
Total Score: 32/40
🏆 Rating
Regency Centers Corporation is rated as a solid investment choice for dividend-seeking investors. The company's strong historical performance, consistent dividend growth, and financial stability make it a reliable asset in a diversified investment portfolio.