November 06, 2025 a 03:31 am

REG: Dividend Analysis - Regency Centers Corporation
📊 Regency Centers Corporation demonstrates a solid track record with a 4.13% dividend yield and over three decades of uninterrupted dividend history. Despite a dividend cut back in 2010, the company has shown resilience and growth in its payouts. Given the current dividend per share of $2.66 USD, the firm displays a commitment to returning value to shareholders, though potential investors should carefully consider the high payout ratio relative to earnings.
Overview
🗣️ Regency operates in a sector that prioritizes dividend payments as a form of shareholder value return. The company offers a current dividend yield of 4.13%, supported by a dividend per share of $2.66. With a dividend history spanning 32 years, Regency has established itself as a reliable income provider. However, investors should note the last dividend cut was in 2010, highlighting past pressures but also showcasing recovery strength.
| Metric | Detail |
|---|---|
| Sector | REIT |
| Dividend Yield | 4.13% |
| Current Dividend Per Share | $2.66 |
| Dividend History | 32 years |
| Last Cut or Suspension | 2010 |
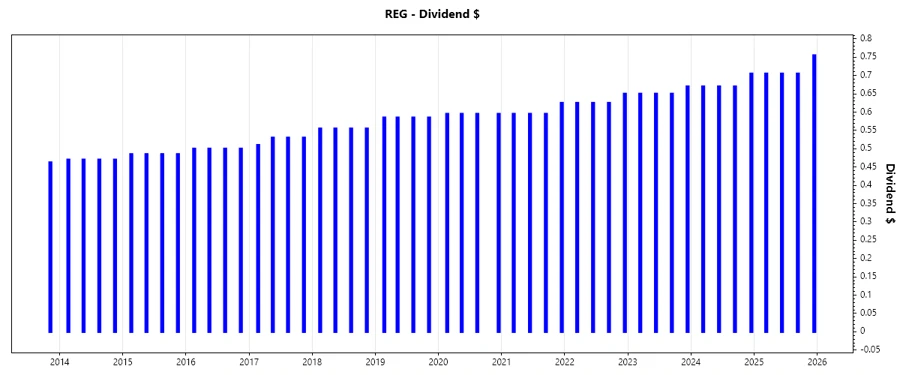
Dividend History
📉 Regency’s robust dividend payment history, shown over decades, indicates a firm commitment to shareholder returns. Such history helps build investor trust and implies future payout stability.
| Year | Dividend Per Share (USD) |
|---|---|
| 2025 | 2.870 |
| 2024 | 2.715 |
| 2023 | 2.620 |
| 2022 | 2.525 |
| 2021 | 2.410 |
Dividend Growth
📈 Tracking dividend growth helps investors understand the company's potential for increasing future payouts. Regency’s growth indicates a positive trajectory but moderate expansion.
| Time | Growth |
|---|---|
| 3 years | 4.05% |
| 5 years | 3.02% |
🚀 The average dividend growth is 3.02% over 5 years. This shows moderate but steady dividend growth.
Payout Ratio
⚠️ The payout ratio indicates how much of earnings are distributed as dividends. A high EPS-based payout ratio of 122.21% suggests the dividend is not fully covered by earnings, which may be unsustainable long-term. However, the 63.51% FCF-based ratio shows better coverage, making dividend payments more reliable from cash flow perspective.
| Key Figure | Ratio |
|---|---|
| EPS-based | 122.21% |
| Free cash flow-based | 63.51% |
Cashflow & Capital Efficiency
🗣️ Cashflow stability and capital efficiency are pivotal for maintaining dividend payouts. Regency’s metrics like Free Cash Flow Yield indicate a solid capability to sustain dividends through operational profits.
| Year | Free Cash Flow Yield | Earnings Yield | Capex to Operating Cash Flow | Stock-based Compensation to Revenue | Free Cash Flow / Operating Cash Flow Ratio | Return on Invested Capital |
|---|---|---|---|---|---|---|
| 2022 | 6.15% | 4.50% | 0.75% | 1.30% | 100.7% | 8.02% |
| 2023 | 6.01% | 3.04% | 27.14% | 1.47% | 100% | 7.25% |
| 2024 | 5.63% | 2.85% | 43.45% | 1.56% | 100% | 7.98% |
Balance Sheet & Leverage Analysis
📊 Analyzing leverage provides insight into the company’s debt load and financial stability. Regency shows moderate leverage ratios, suggesting controlled debt levels in relation to assets and equity.
| Year | Debt-to-Equity | Debt-to-Assets | Debt-to-Capital | Net Debt to EBITDA | Current Ratio | Quick Ratio | Financial Leverage |
|---|---|---|---|---|---|---|---|
| 2022 | 0.704 | 0.395 | 0.413 | 5.17 | 0.812 | 1.78 | |
| 2023 | 0.682 | 0.386 | 0.406 | 5.61 | 0.637 | 1.77 | |
| 2024 | 0.746 | 0.405 | 0.427 | 5.28 | 0.730 | 1.84 |
Fundamental Strength & Profitability
🗣️ High returns on equity and assets, alongside robust margins, reflect profitability and operational efficiency, crucial for long-term dividend sustainability.
| Year | Return on Equity | Return on Assets | Net Margin | EBIT Margin | EBITDA Margin | Gross Margin | R&D to Revenue |
|---|---|---|---|---|---|---|---|
| 2022 | 7.92% | 4.45% | 37.99% | 40.86% | 64.36% | 72.78% | 0% |
| 2023 | 5.18% | 2.93% | 26.61% | 37.70% | 61.29% | 71.18% | 0% |
| 2024 | 5.95% | 3.23% | 26.63% | 37.77% | 62.51% | 71.19% | 0% |
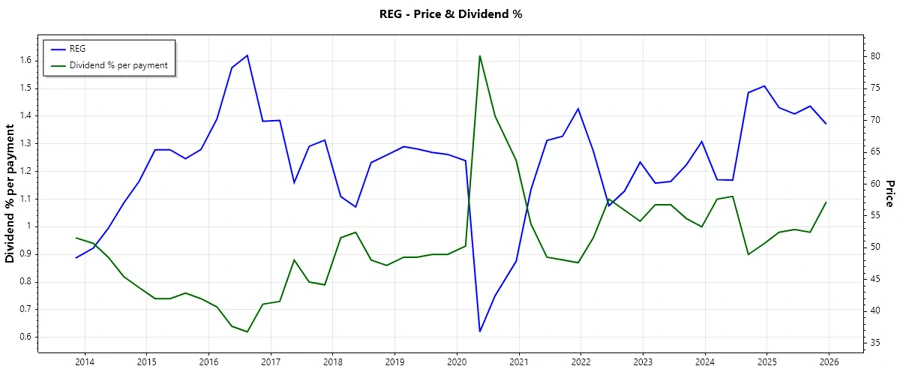
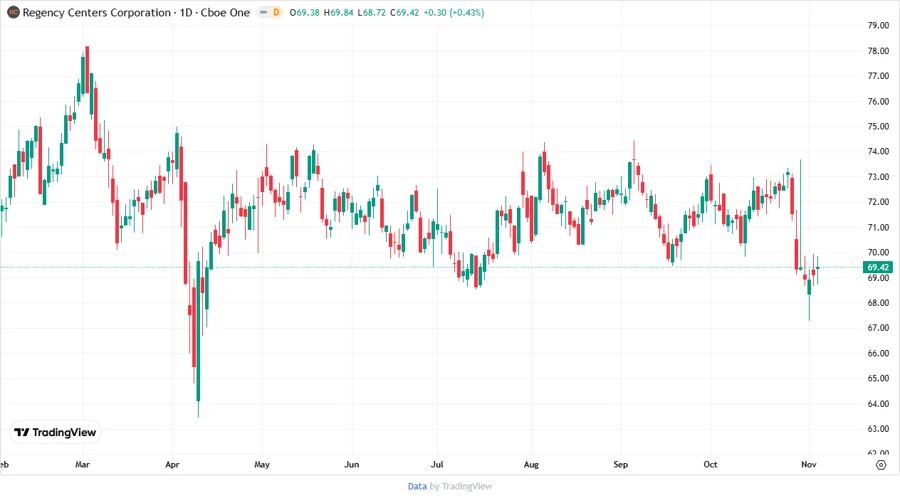
Price Development
Dividend Scoring System
🧮 Here is an evaluation of Regency’s dividend strength based on various financial metrics:
| Category | Score | Score Bar |
|---|---|---|
| Dividend yield | 4 | |
| Dividend Stability | 4 | |
| Dividend growth | 3 | |
| Payout ratio | 2 | |
| Financial stability | 3 | |
| Dividend continuity | 4 | |
| Cashflow Coverage | 3 | |
| Balance Sheet Quality | 3 |
Total Score: 26/40
Rating
✅ In conclusion, Regency Centers Corporation offers a well-rounded dividend profile suitable for income-focused investors. With a consistent yield and sound financial metrics, the company remains an attractive option, bearing in mind the high EPS payout ratio.
Smart Data Insight
Master the Perfect Entry & Exit for this Stock
Don't leave your profits to chance. Historically, this stock follows specific seasonal patterns that institutional traders use to maximize returns.
- ✅ Identify the "Golden Buying Window"
- ✅ Avoid high-risk correction cycles
- ✅ Backtested data from the last 20+ years